I have been designing digital products for 7 years. Today I lead design at Zeev, used by more than 350,000 people.
I’m a product designer and UX Engineer. I research, design and code interfaces that are clear and easy to learn, from SaaS platforms to design systems.
Zeev: processes and AI agents for more than 350,000 people
From the design system to the front-end: how I reorganized the interface of Stoque’s process automation platform.
Role
Senior UX/UI Designer
Period
2021 to now
Impact
350k+ people
4.49 ★
on Capterra, up from 3.1
6×
Global Awards for Excellence in BPM
50+
components, from Figma to code
+30%
faster front-end delivery
The product
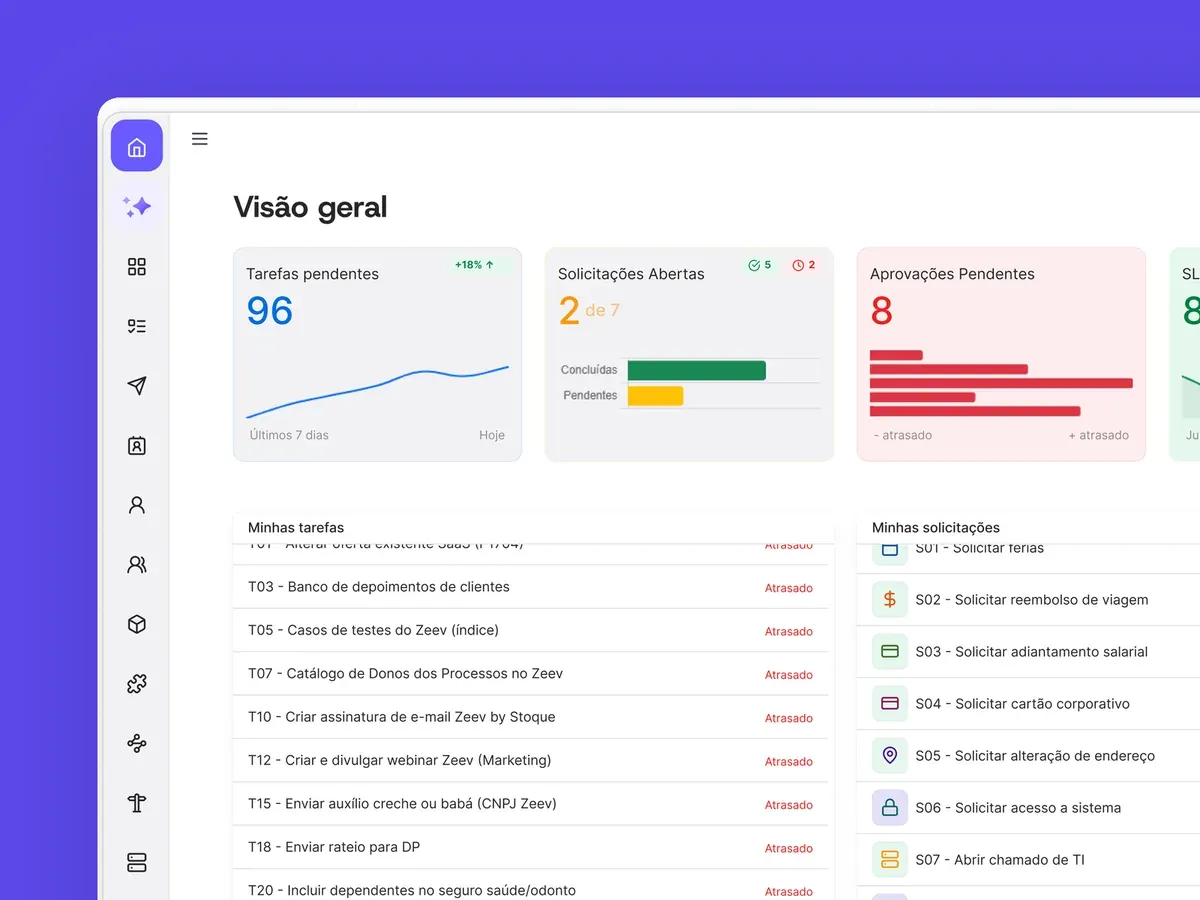
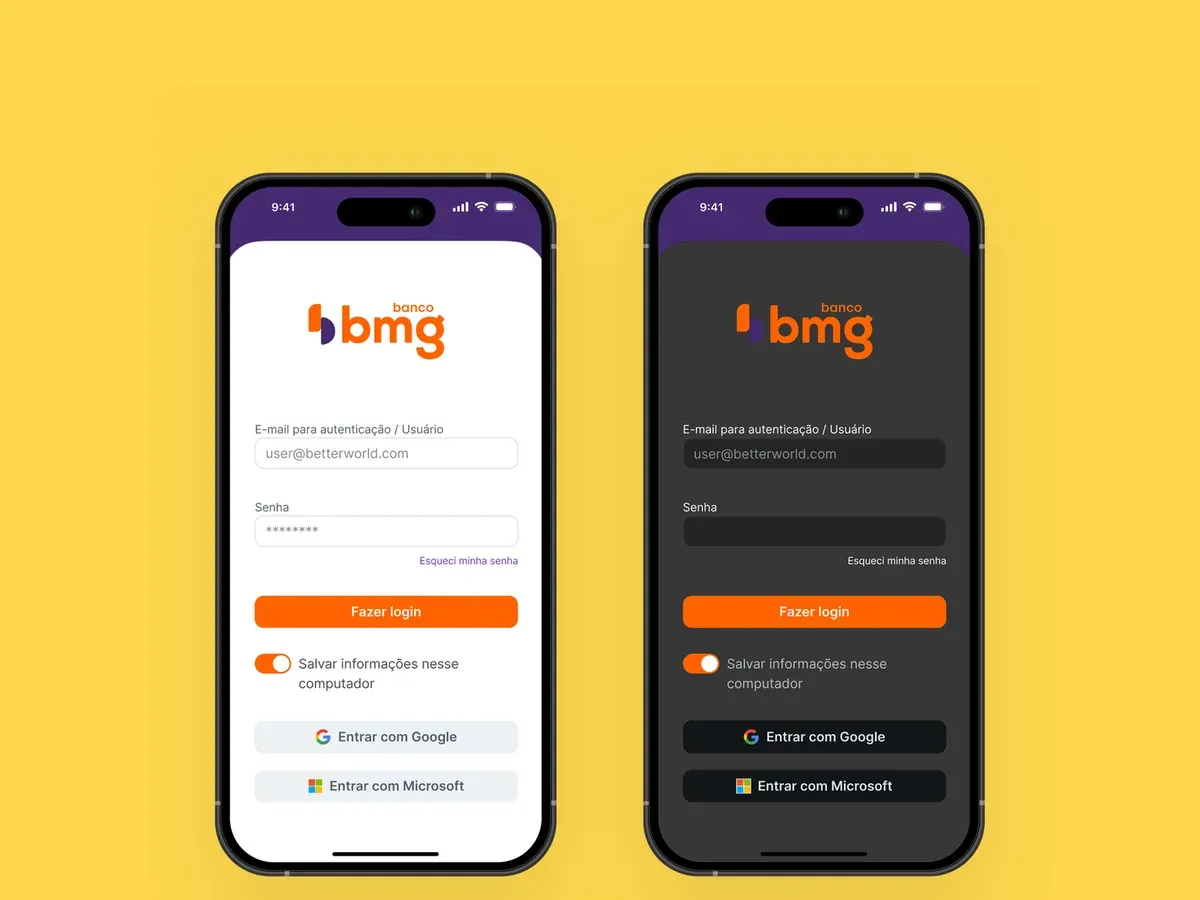
Zeev automates processes for companies such as Itaú, Sympla, Banco BMG and TIM, from vacation approvals to customer service with AI agents. I led the evolution of the interface: a robust but visually fragmented platform became a cohesive, scalable, white-label system. Zeev runs thousands of critical operations, and every change had to keep their precision and traceability.
The challenge
Years of decentralized development left more than twenty inconsistent modules, with no mobile support and no WCAG compliance. Figma and code did not match, and engineering lived with rework and bugs. To build a foundation that would scale, the project focused on a new design system and structural UX fixes.
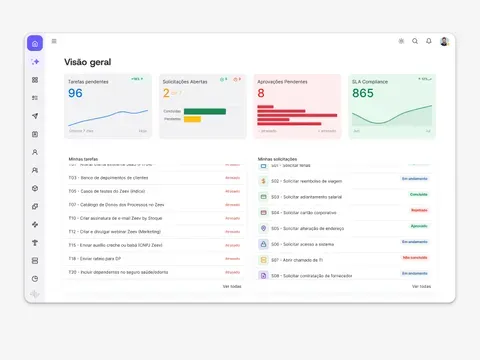
The interface before the new design system.
The solution
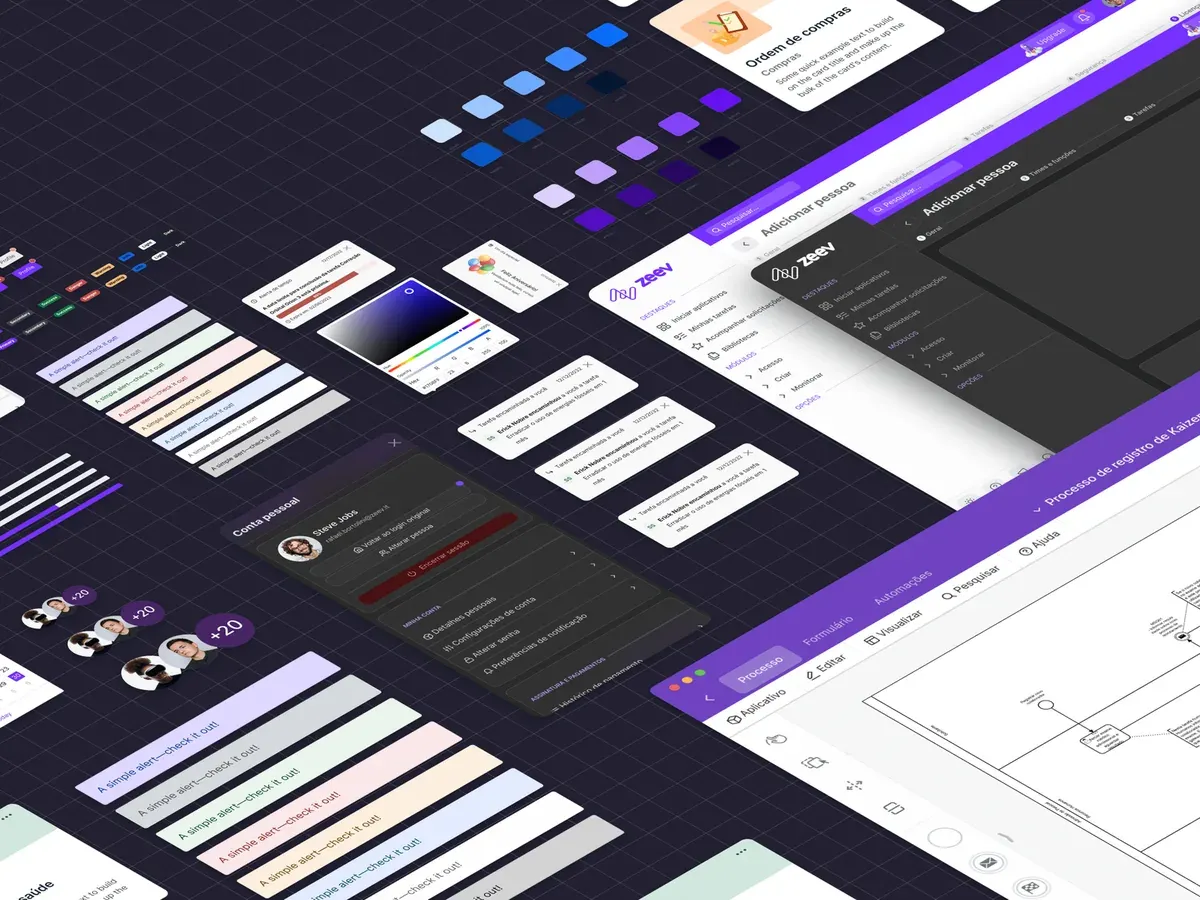
I designed and coded zeev-bootstrap, a layer on top of Bootstrap, which engineering already knew. Tokens in CSS custom properties turned on the dark theme without refactoring code. There are more than 50 documented components, and each Figma layer name is the CSS class name.
Choosing Bootstrap was pragmatic: on a familiar base, the learning curve was shorter and product and sales adopted the system faster. The developer documentation covers how to instantiate each component, the accessibility rules and versioning.
zeev-bootstrap: production-ready components.
The rebuilt modules
With the system in place, I led the migration of the Workflow Builder, the Process Manager and the dashboards, with AA contrast, visible keyboard focus, ARIA in modals and layouts from phone to ultrawide. Critical flows went through usability tests.
The form builder in the dark theme, driven by the tokens.
How the team ships
I also changed how the team ships:
Metrics and OKRs: quarterly usability audits that backed the roadmaps presented to leadership.
Continuous improvement: workflow retrospectives that reduced friction between discovery, prototyping and delivery.
AI in the workflow: Claude and Copilot generating mockups in code, and LLMs analyzing UX data.
Documented handoff: states specified in the user stories, with fewer alignment meetings.
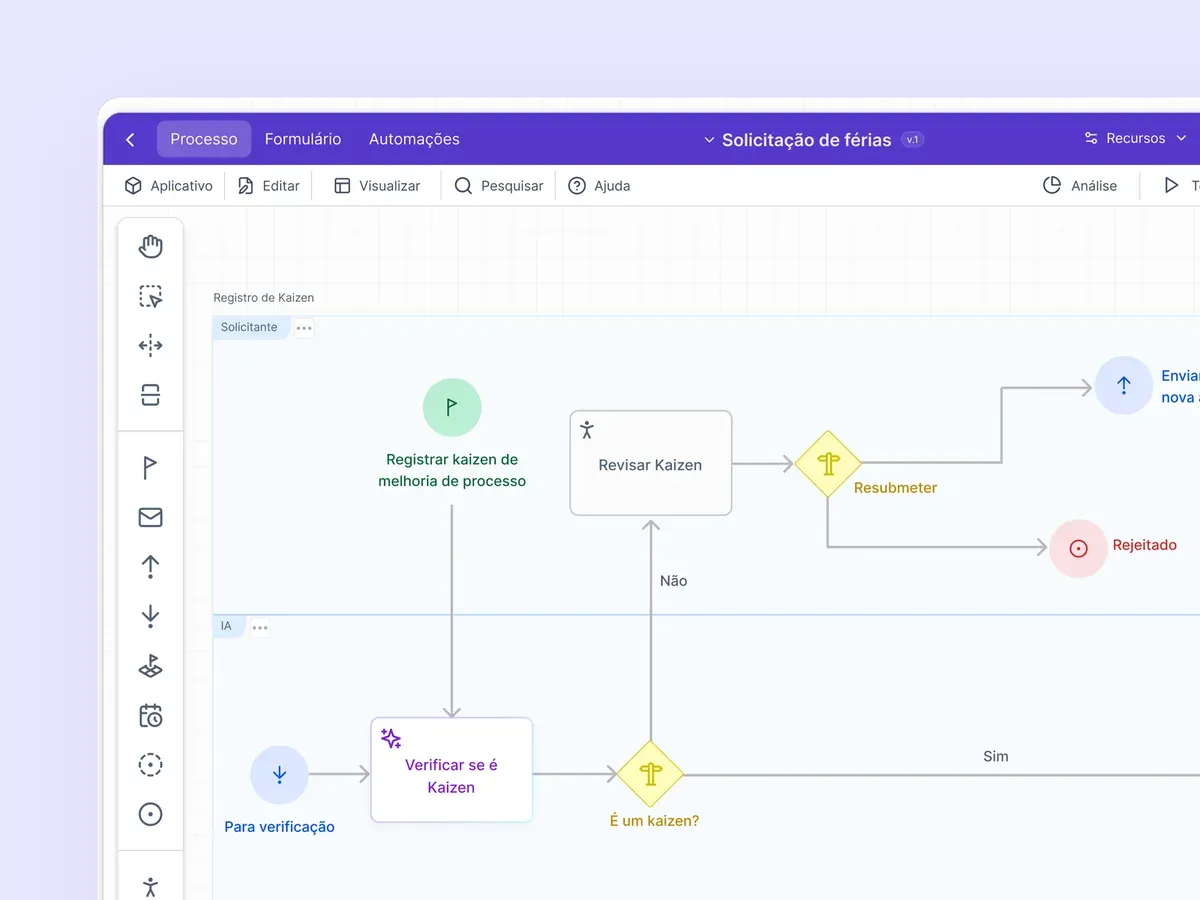
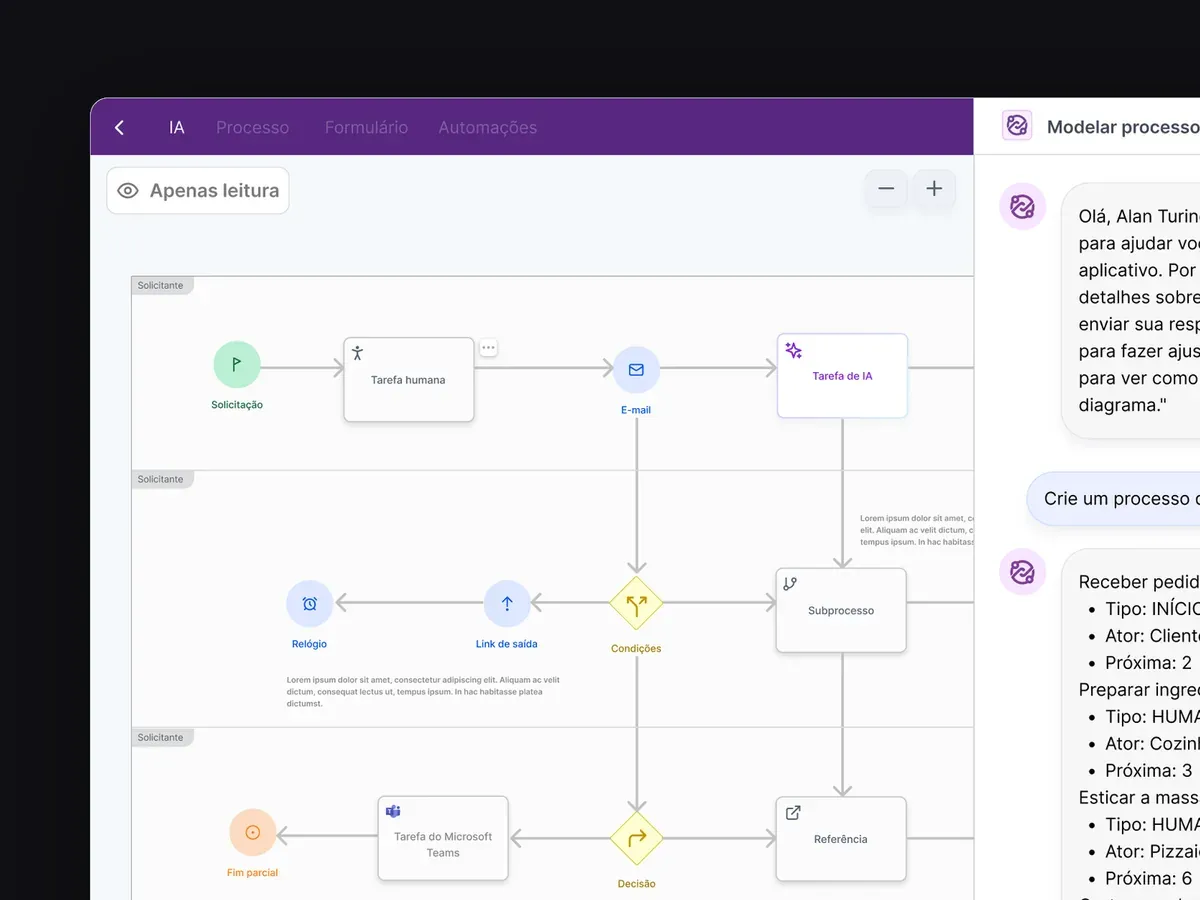
The AI copilot draws the process in the BPMN editor.
The result
+43% on Capterra: from 3.1 to 4.49 stars.
+150% adoption in the enterprise segment, without losing stability.
+30% faster front-end delivery, with components already tested.
Fewer tickets about basic navigation.
A unified brand under the new corporate requirements.
SuaMEI · 2020 to 2022
SuaMEI: financial management for micro-entrepreneurs
Architecture, modules and visual system of a fintech for Brazilian micro-entrepreneurs (MEIs), on desktop and mobile.
Role
Junior UX/UI Designer
Contract
Contractor, 2020 to 2022
Scope
6 modules, desktop and mobile
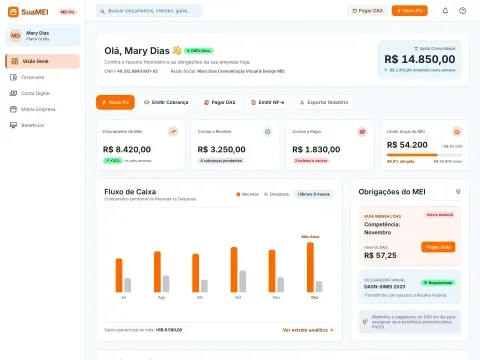
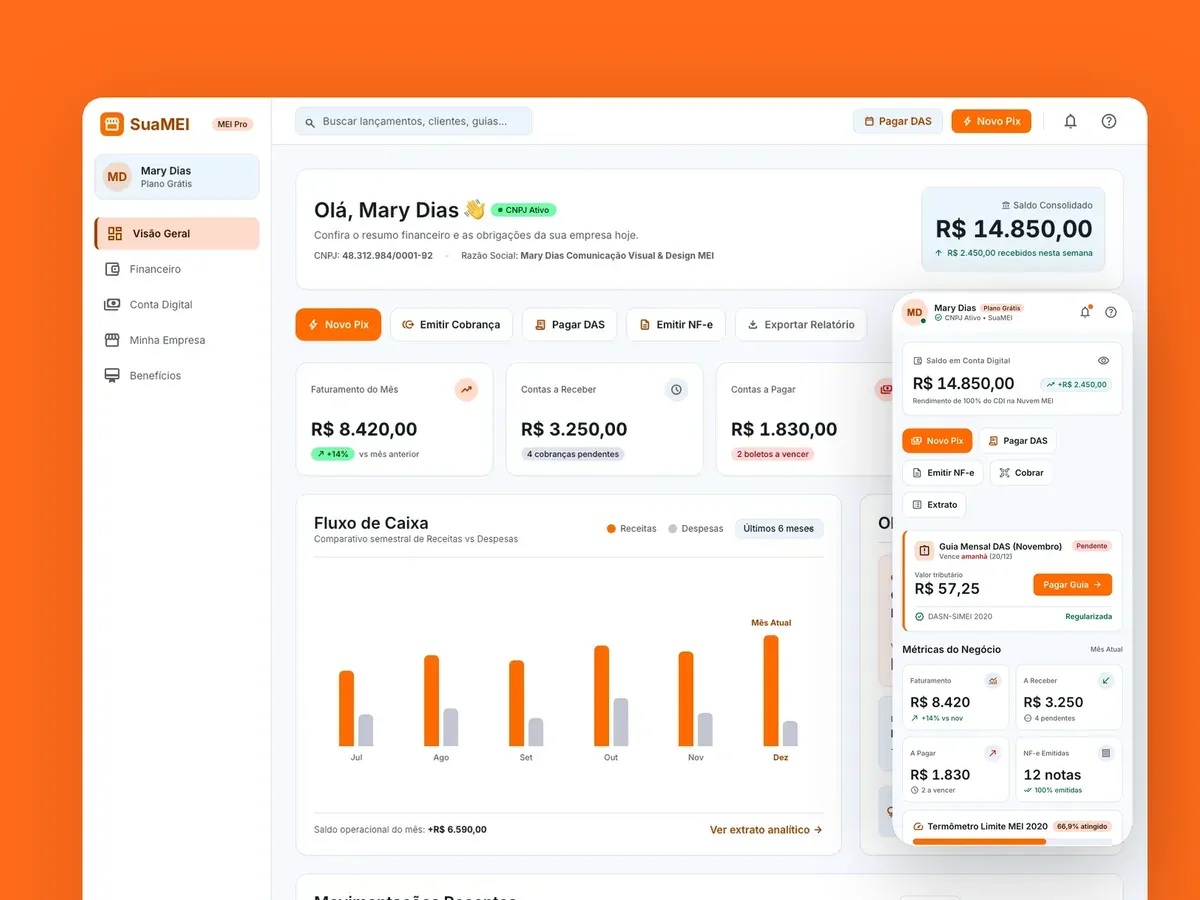
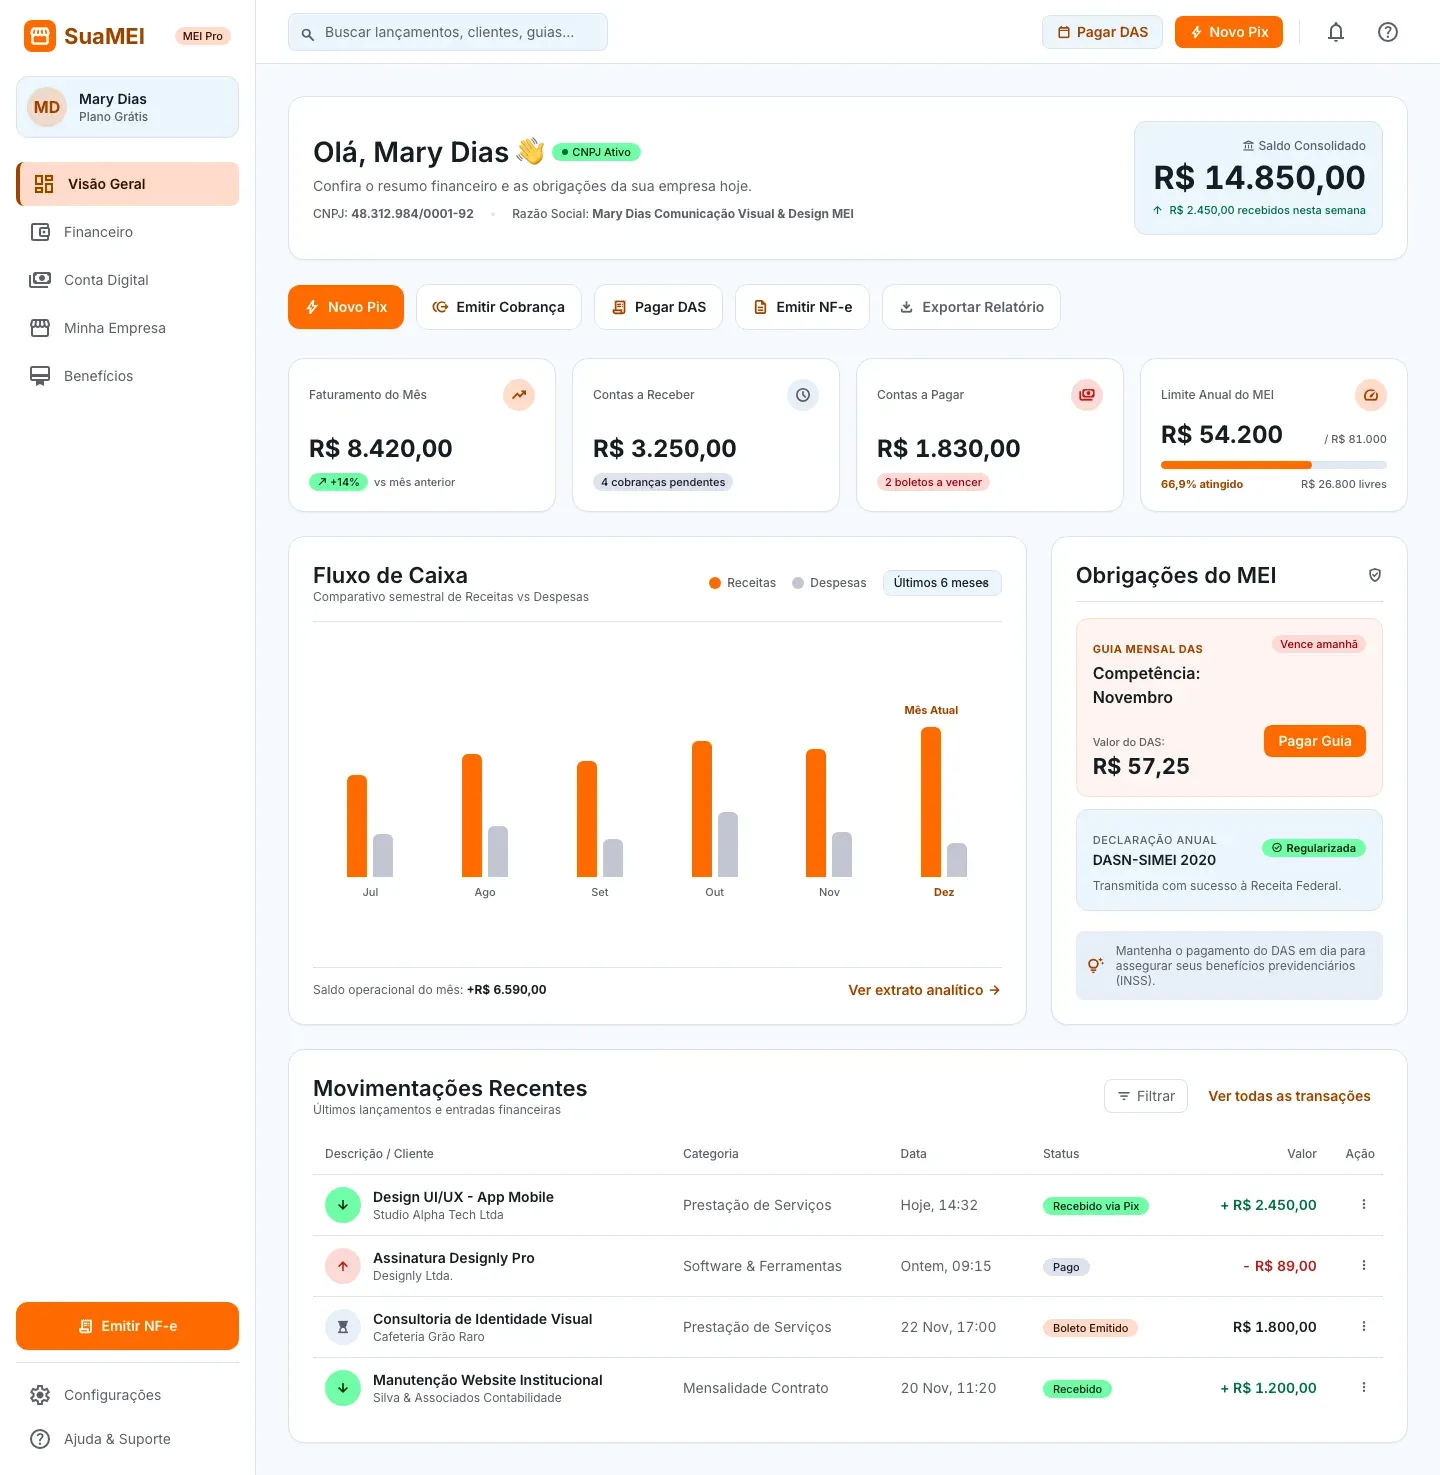
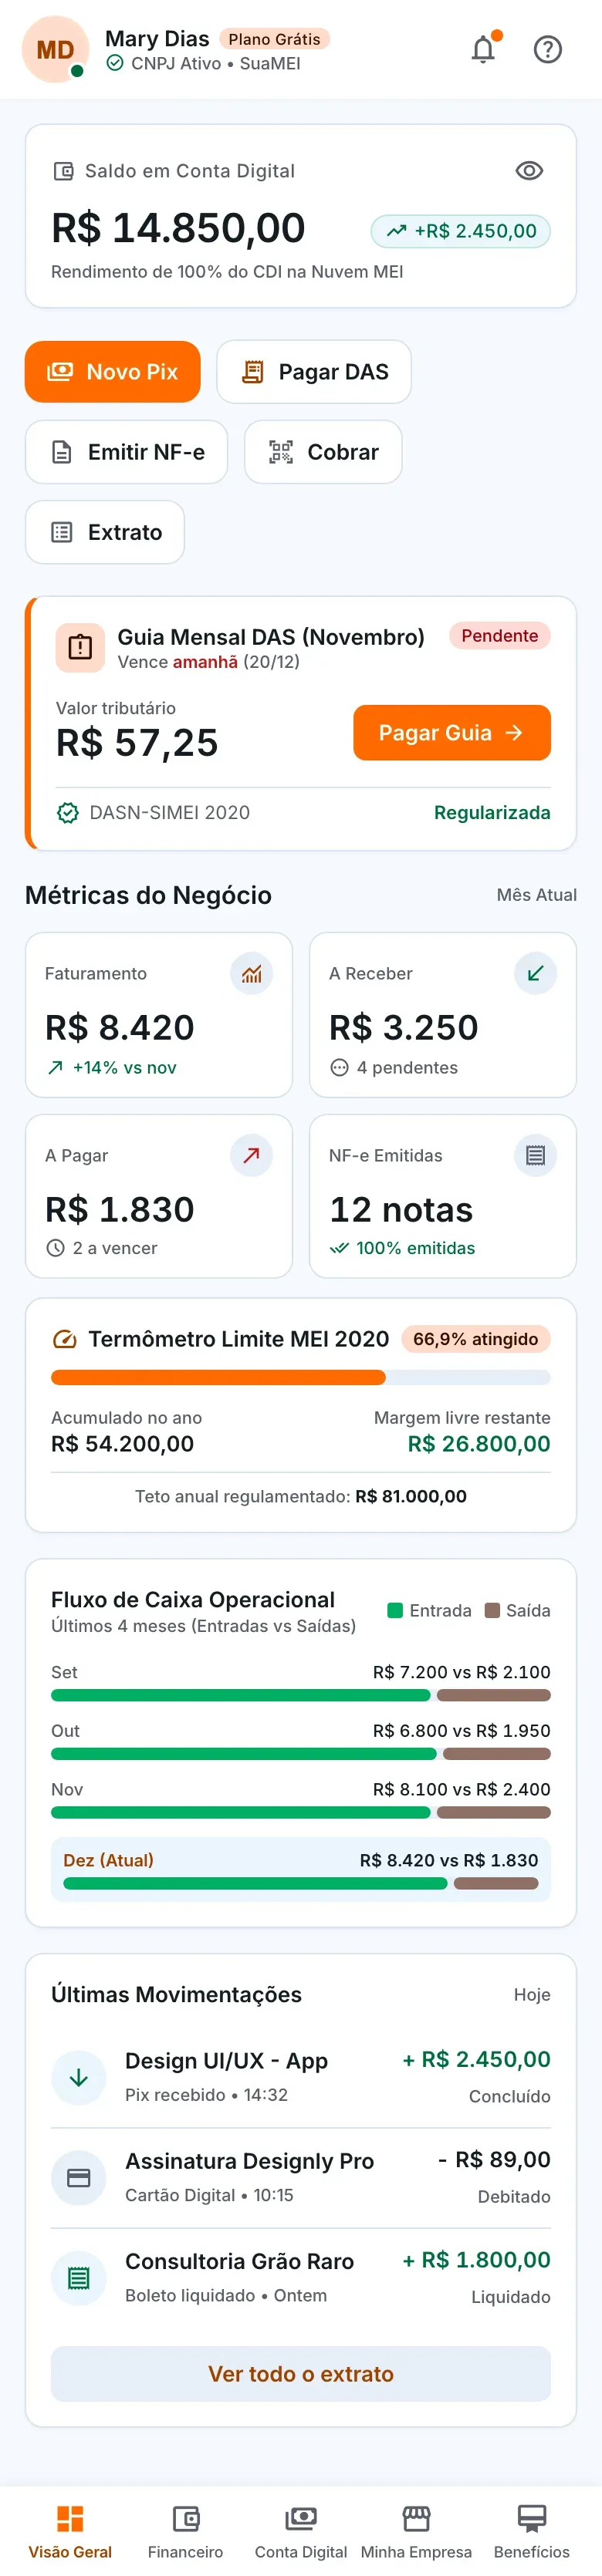
Screens rebuilt in Google Stitch from the product brief, with fictional data.
2,500+
MEIs served
250+
companies
R$ 8.1M
in invoices issued
The context
Seven in ten MEIs are not compliant, according to Sebrae, often without knowing it. SuaMEI brings together a digital account, taxes, invoices, contracts and benefits that used to be scattered across government portals and banks. The challenge was to translate MEI law for people who are not finance experts and use their phone in the middle of the workday. I worked on the whole cycle, from research to usability tests.
The architecture
Overview: financial summary, indicators and shortcuts.
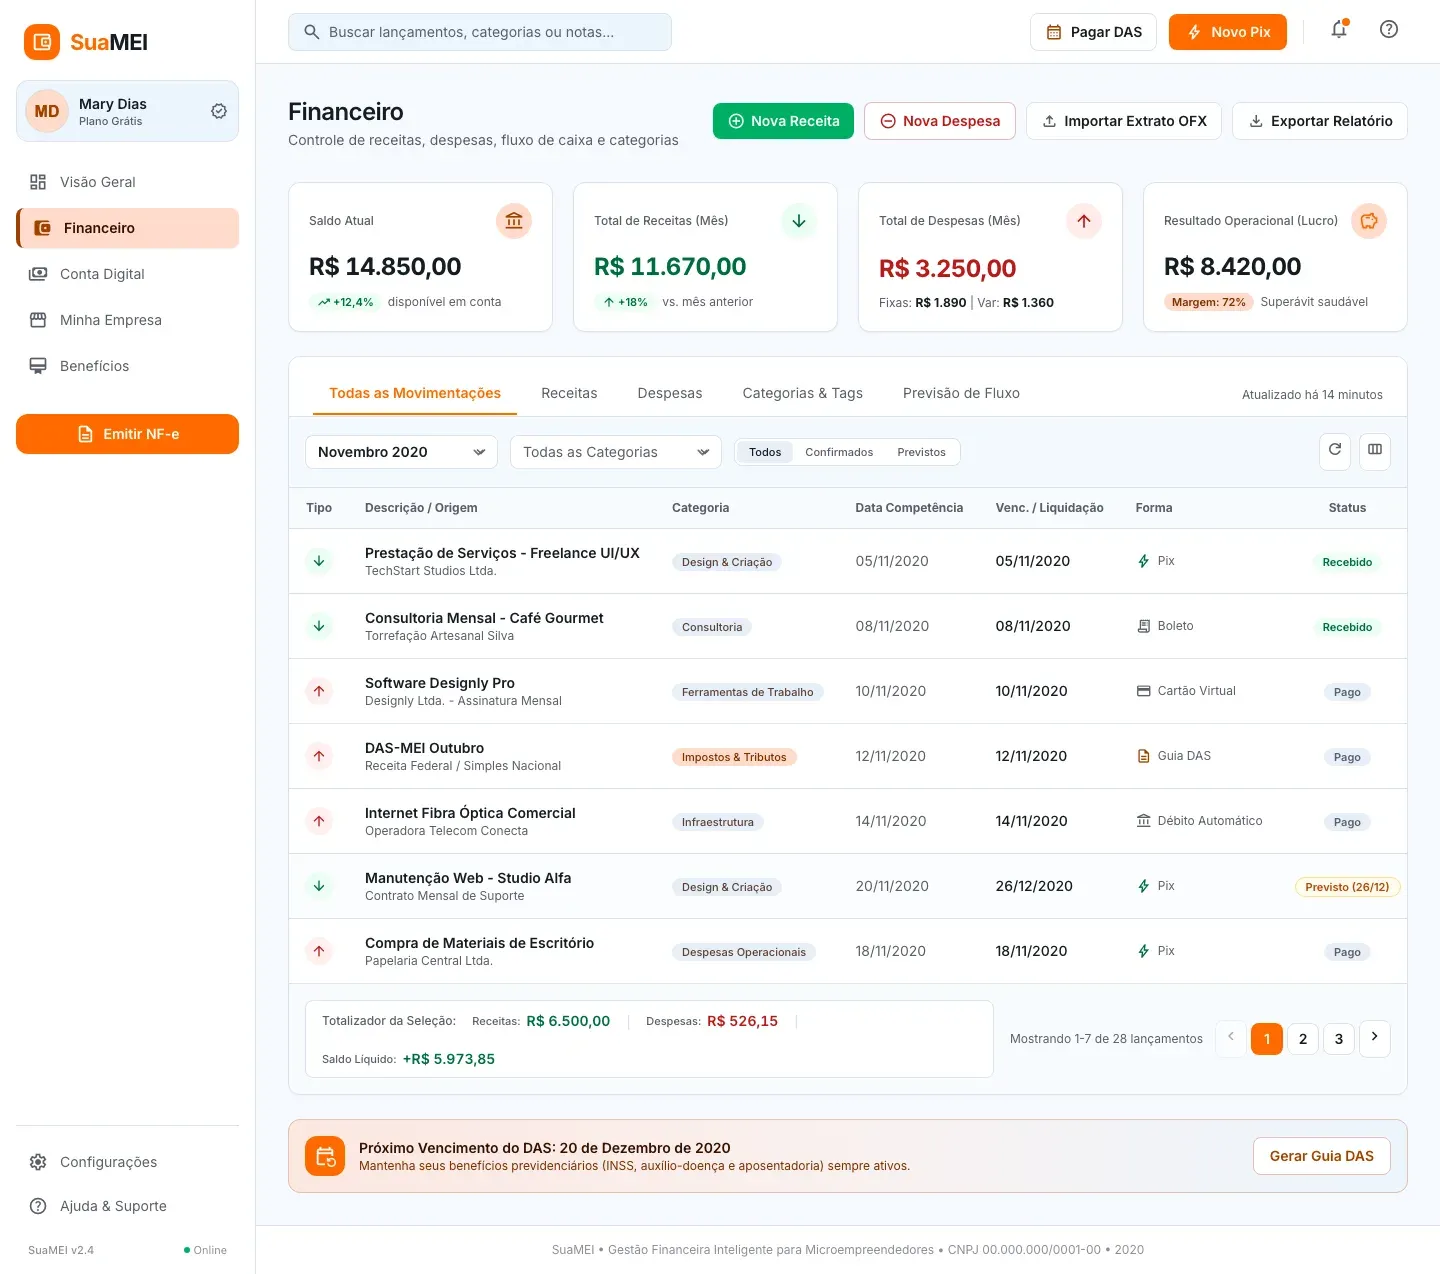
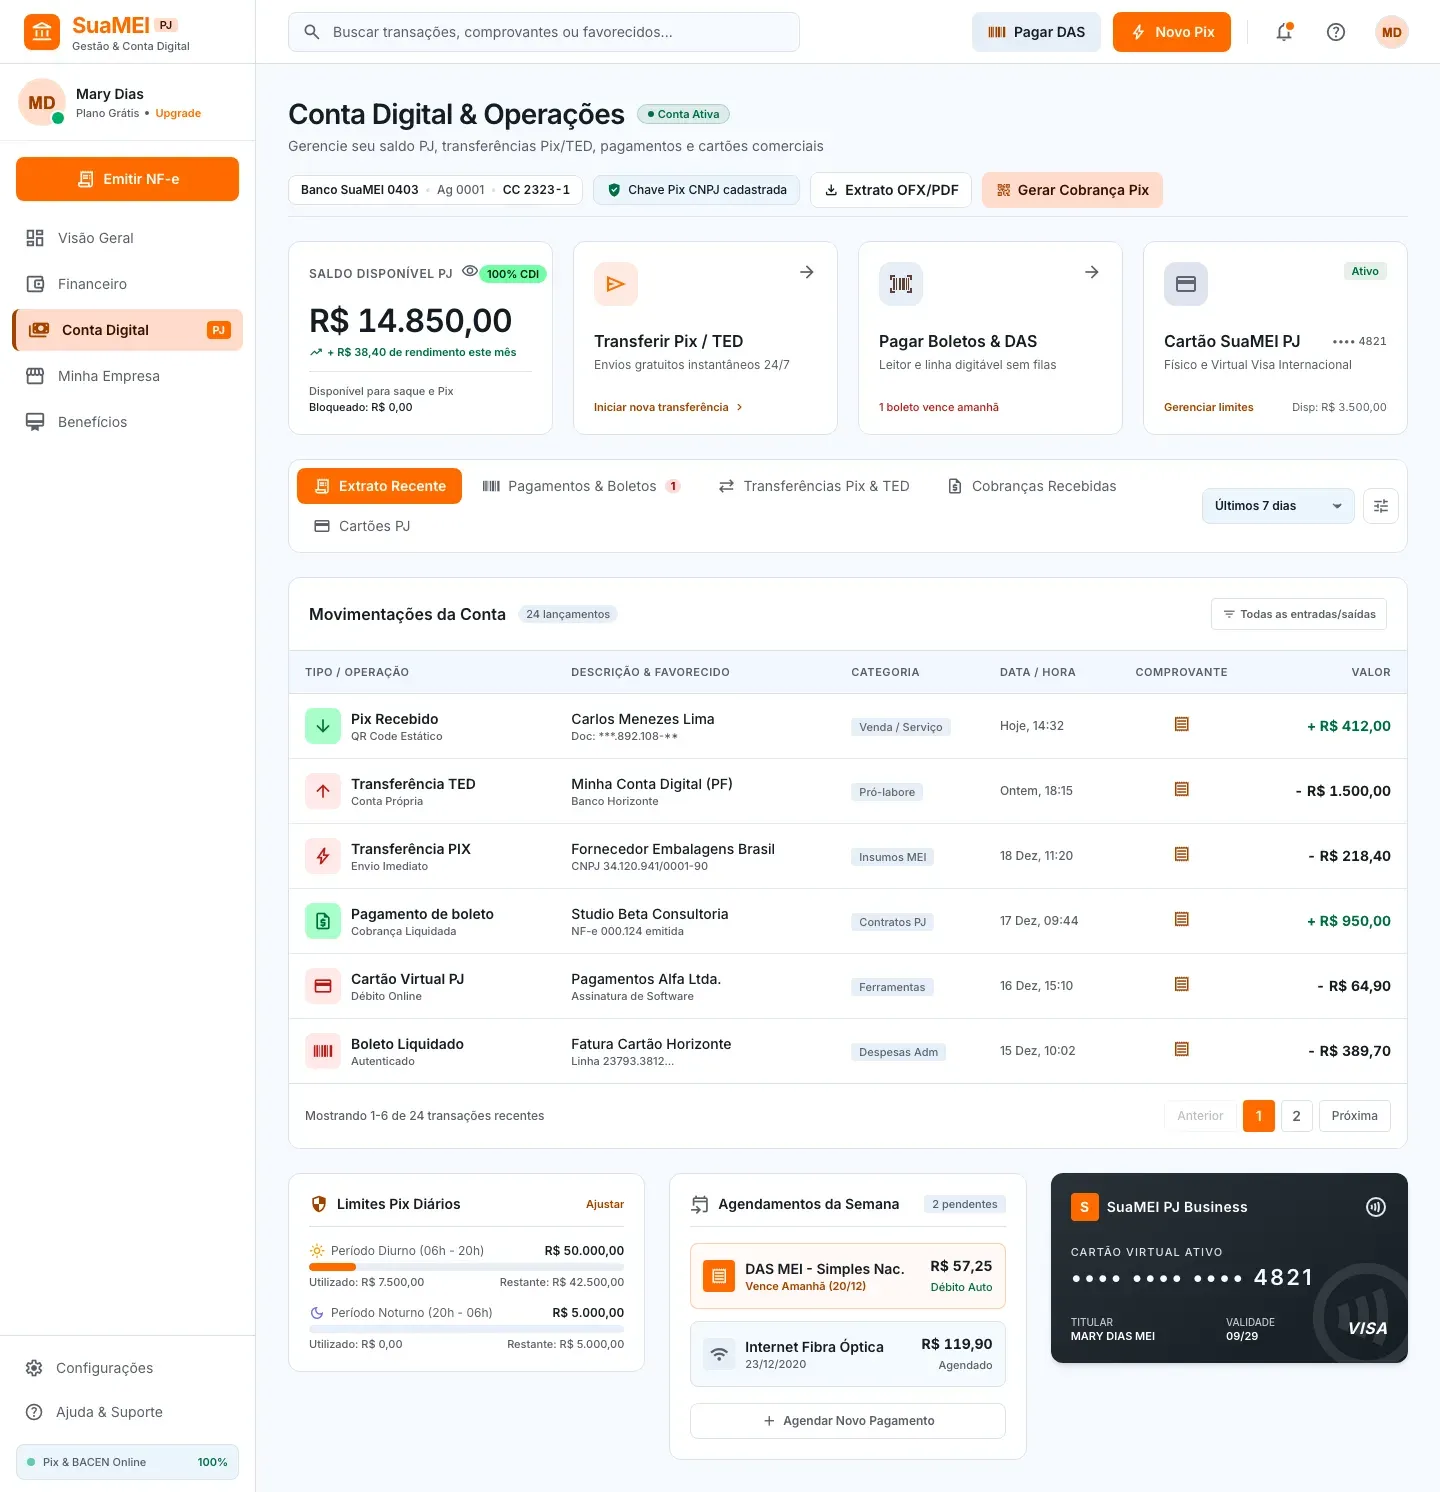
Finance and Digital Account: income, expenses, statement, Pix, payments and card.
My Company: registration data, taxes, invoices and contracts.
Benefits: catalog, sign-up and management.
My Account and Preferences: profile, bank accounts, categories and tags.
Six areas, with frequent tasks up front and plain language. Pay DAS and New Pix are one tap away on every screen, information is kept apart from actions that move money, and fees and deadlines show before confirmation.
Finance: income and expenses in separate tabs.
The modules
In Finance, income and expenses got their own tabs, because tests showed people wanted to see first what came in that month. In My Company, the DAS tax slip shows the amount, due date and code, without sending anyone to the government portal. In the Digital Account, the balance and the actions that move money sit in the top cards, apart from the statement. In Benefits, four offers share the same card structure, with price, coverage and one action each.
Digital Account: what moves money stays apart from what only informs.
The visual system
White background, readable type and the brand orange only on the main button and the active menu item. Green and red appear only as status. Whatever is due or late moves up the hierarchy; whatever only informs stays in the background. The Figma library, with documented tokens, covered desktop and mobile, and the handoff included following the HTML and CSS implementation.
On mobile
Access happens almost always on the phone, often on a shaky connection. The five main modules move to a bottom bar, and frequent actions such as New Pix, Pay DAS and Issue invoice become buttons at the very top.
What I took away
Payment, invoicing, account opening and CNPJ compliance were prototyped and tested with users before development. Payment always ends with a review of the details and confirmation with a password.
CYTEI · 2020, revisited in 2026
CYTEI: a solar energy SaaS for five user profiles
From the 2020 information architecture to a redesign of the platform for desktop and mobile.
Role
Junior UX/UI Designer
Contract
Contractor, 3 months (2020)
Model
B2B and B2C SaaS
Scope
5 profiles, 6+ modules
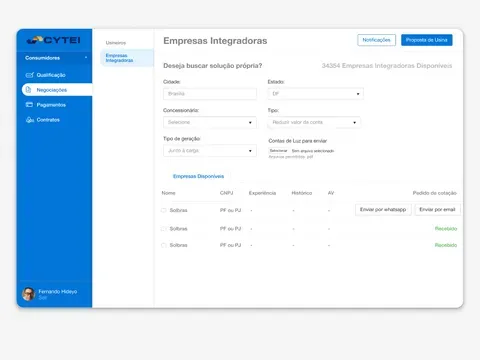
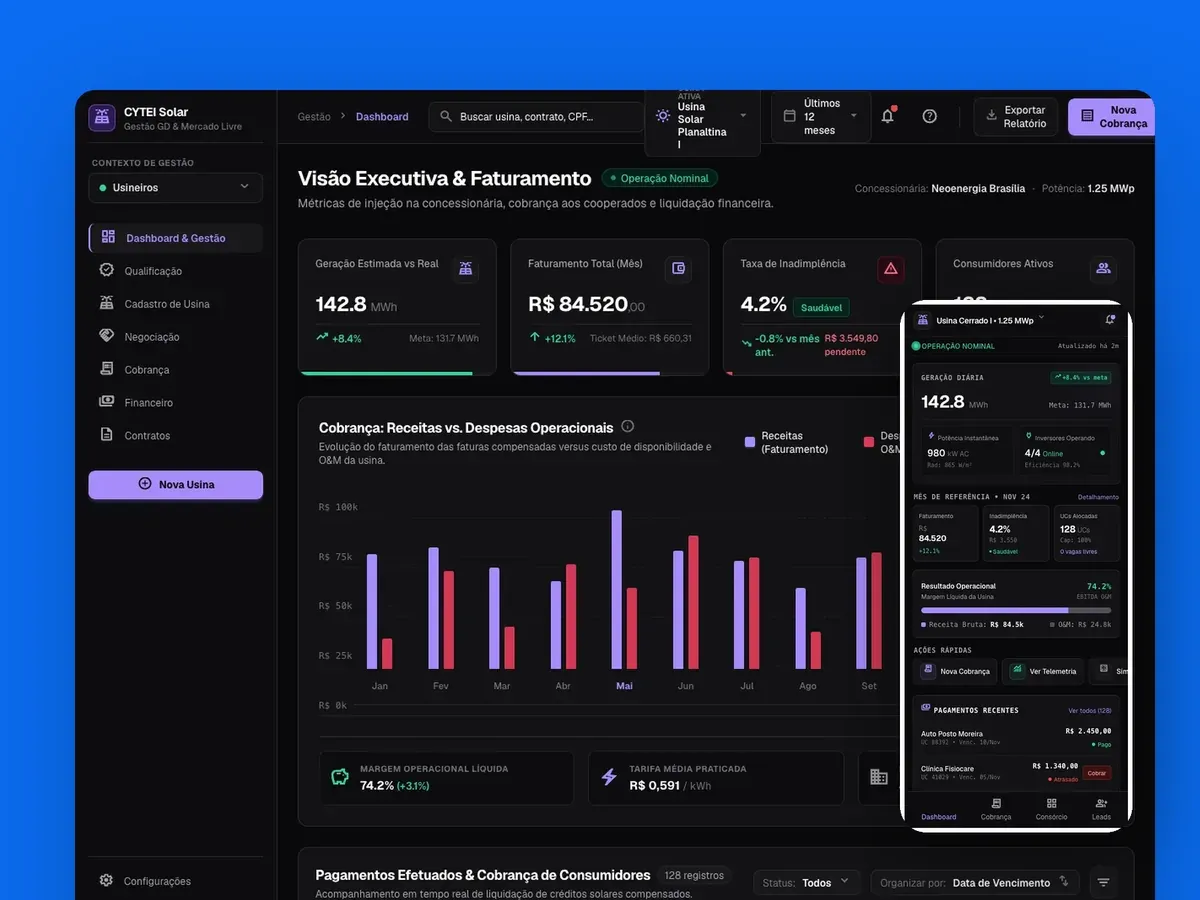
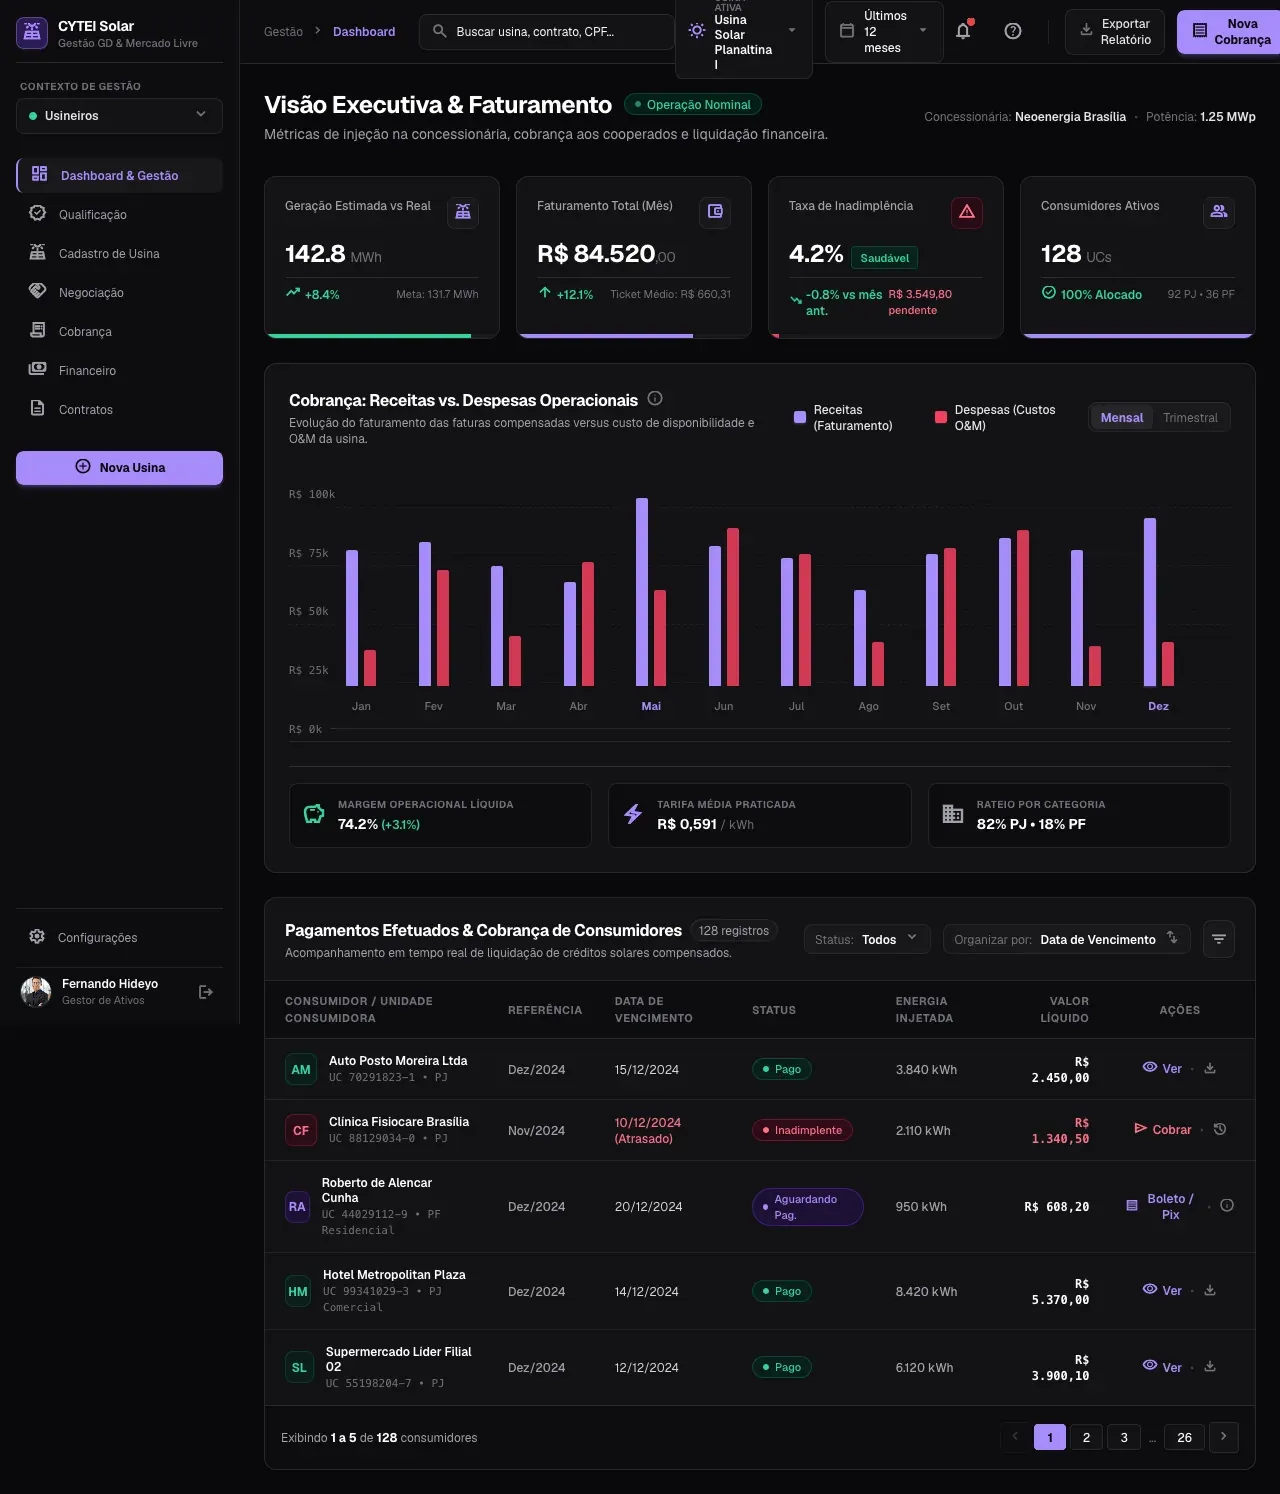
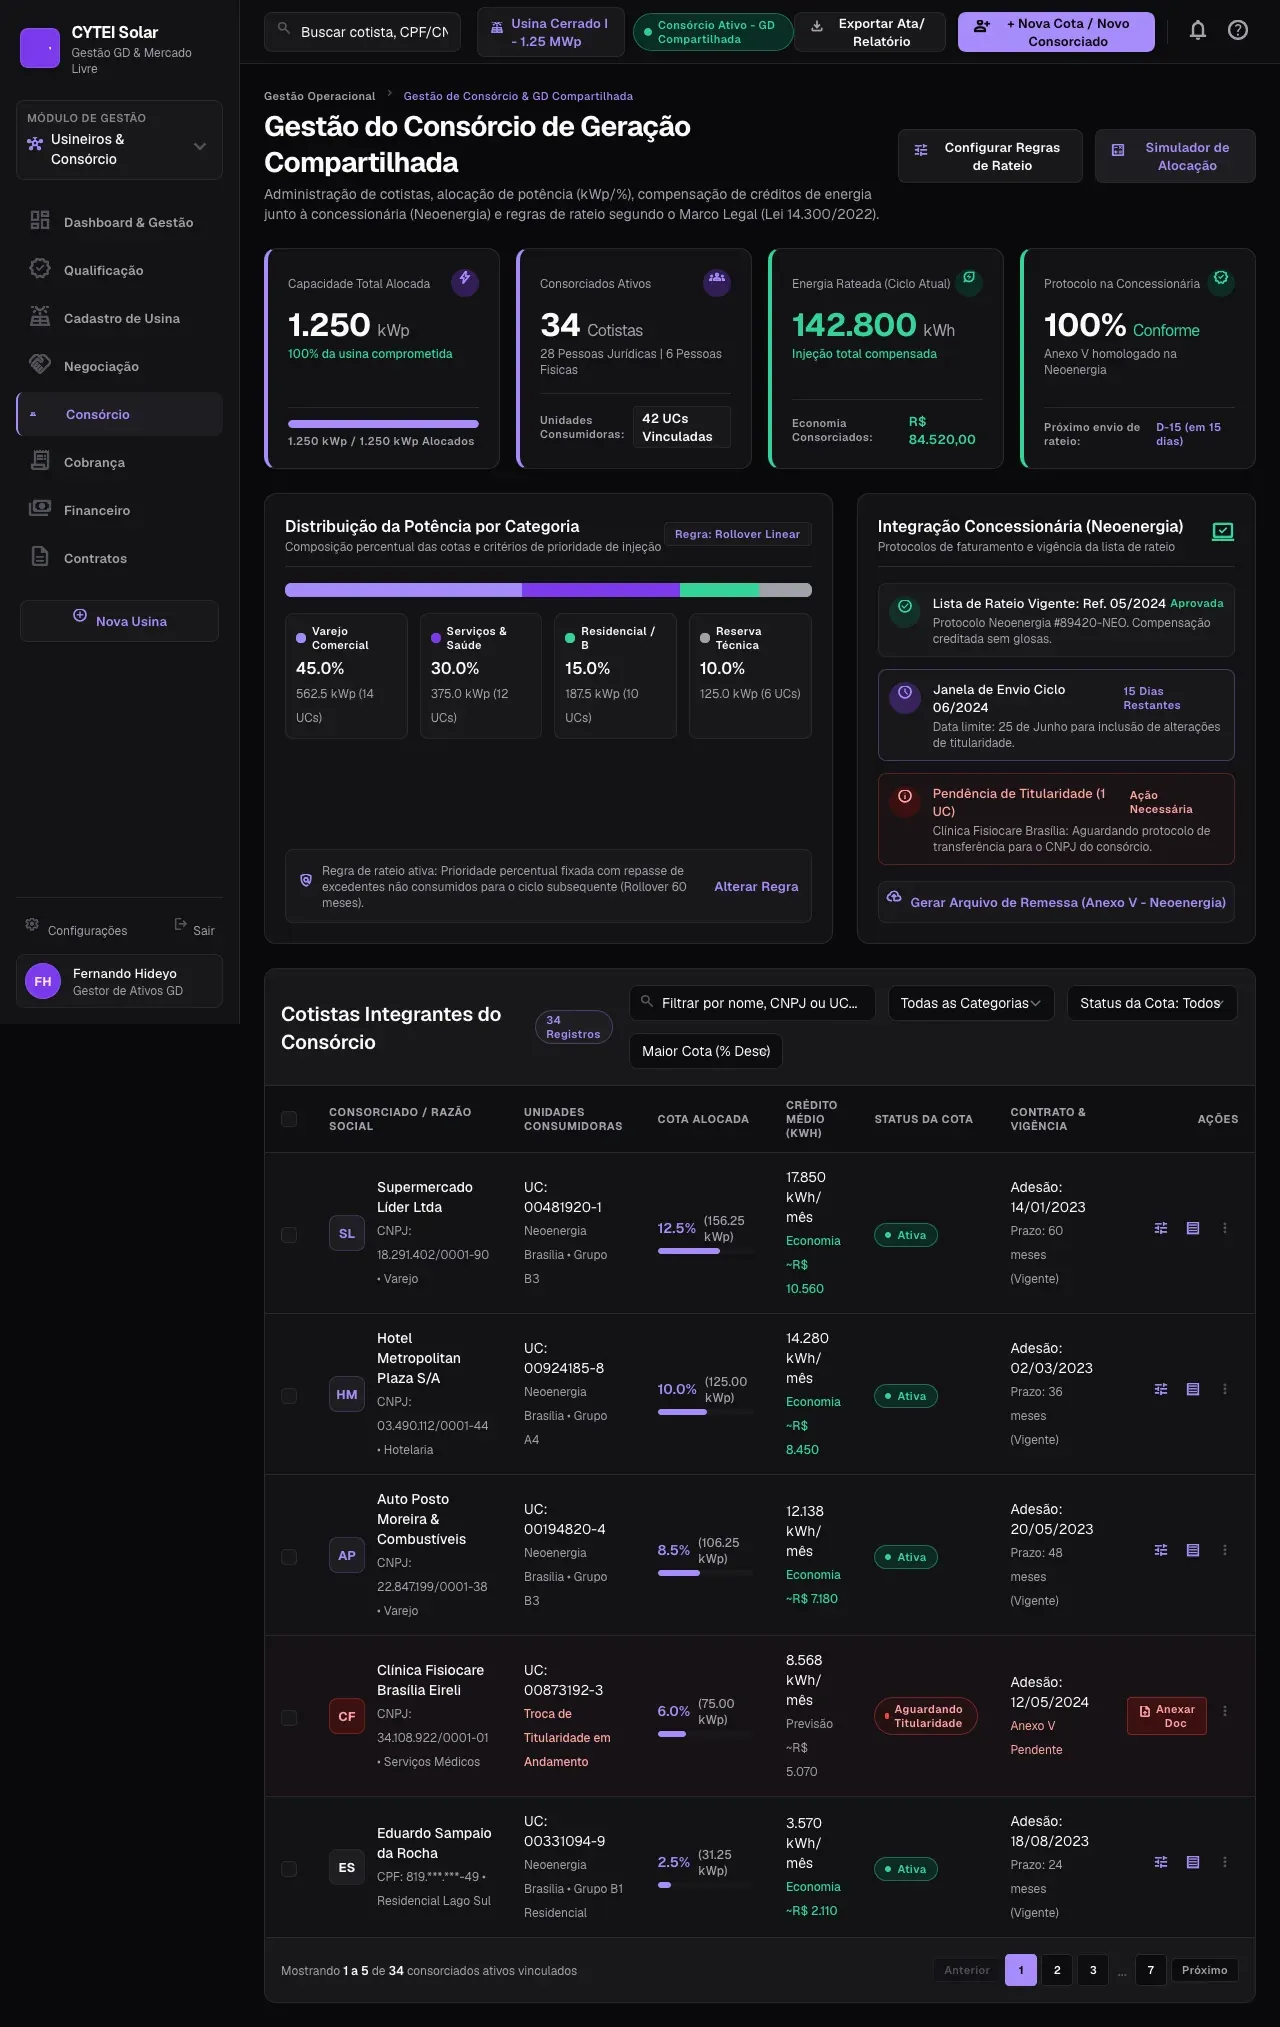
The redesigned dashboard. All screen data is fictional.
The starting point
In 2020, solar plants tracked billing in spreadsheets, investors got numbers by email and consumers did not know where to start. CYTEI brought these pieces together in one platform. Plants and investors needed a lot of information on screen; consumers needed a clean screen that told them how much they would save. Two platforms were out of the question, so one structure had to change its density depending on who was logged in.
Five profiles, five questions
Solar plants: how much did I bill, who owes me and how much energy do I still have to sell?
Investors: where is my money, at what rate and with what risk?
Consumers: how much do I save and what do I need to sign?
Specialists and EPC contractors: who needs labor and when am I free?
Integrators: how do I prove I am reliable and find clients?
If an element did not help answer a profile’s question, it left that profile’s screen.
Architecture before screens
Each module stands on its own, and the menu shows only what makes sense for the logged-in profile: consumers never see the accounting area. Each profile sees a smaller product, and the company can add modules without redesigning the navigation.
Dashboard: overview and charts from January to December.
Management and finance: payments, billing, income, expenses, invoices and accounting.
Plants: registration and technical data such as subgroup, load and output in MWp.
Deals: consumers, investor partners, specialists and EPC.
Contracts: signed contracts, financing and standard terms.
Qualification, access and account: profile data, permissions, departments and WhatsApp and email notifications.
Onboarding followed the same logic: companies and individuals go through different qualifications, and each step asks only for what that profile needs to provide. Four visual rules kept everything consistent as the modules grew:
Color only for status: green for paid, red for overdue, yellow for whatever waits on someone.
Side navigation, to leave the width for tables and charts.
Action on the data row: bill or send the contract without opening another screen.
Numbers with context: always next to last month, the goal or the average ticket.
The redesign
In 2026, I went back to the project to test whether that architecture would hold up after Brazil’s new distributed generation law (Law 14.300/2022). I wrote a short art direction: a high-contrast dark theme, violet only for what is clickable, green for positive states, red only for errors and thin borders instead of shadows. I generated the screens in Google Stitch from the original structure and worked on top of the result, keeping the four rules. The platform gained two modules, shared generation and automatic reading of power bills.
Side by side, 2020 and the redesign show what I wanted to check: the sidebar, the indicators on top and the table with row actions stay in the same place. The structure took the new modules without changing.
Module by module
On the dashboard, each of the four indicators (generation, revenue, delinquency and active consumers) shows the comparison with the previous period and a thin bar to the goal. In the payments table, the action changes with the status: those who paid get the receipt, those who are late get the bill button.
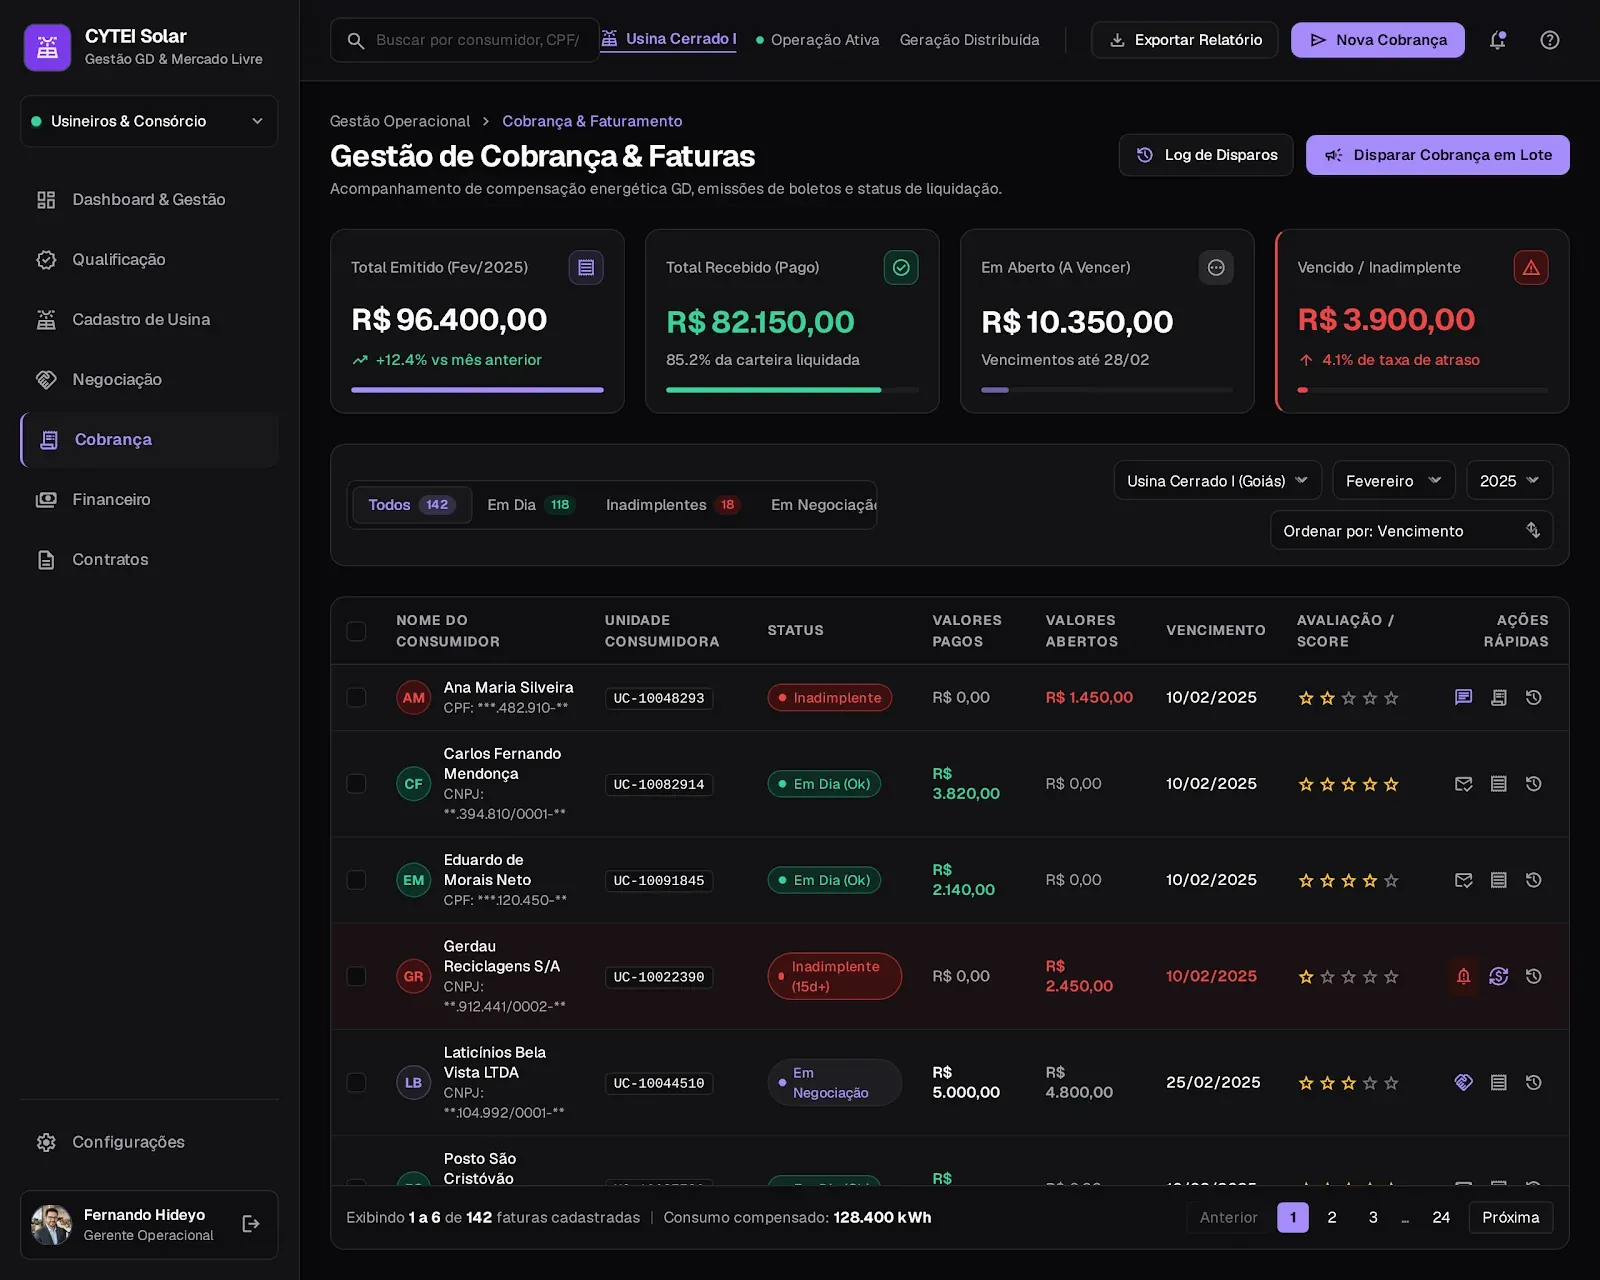
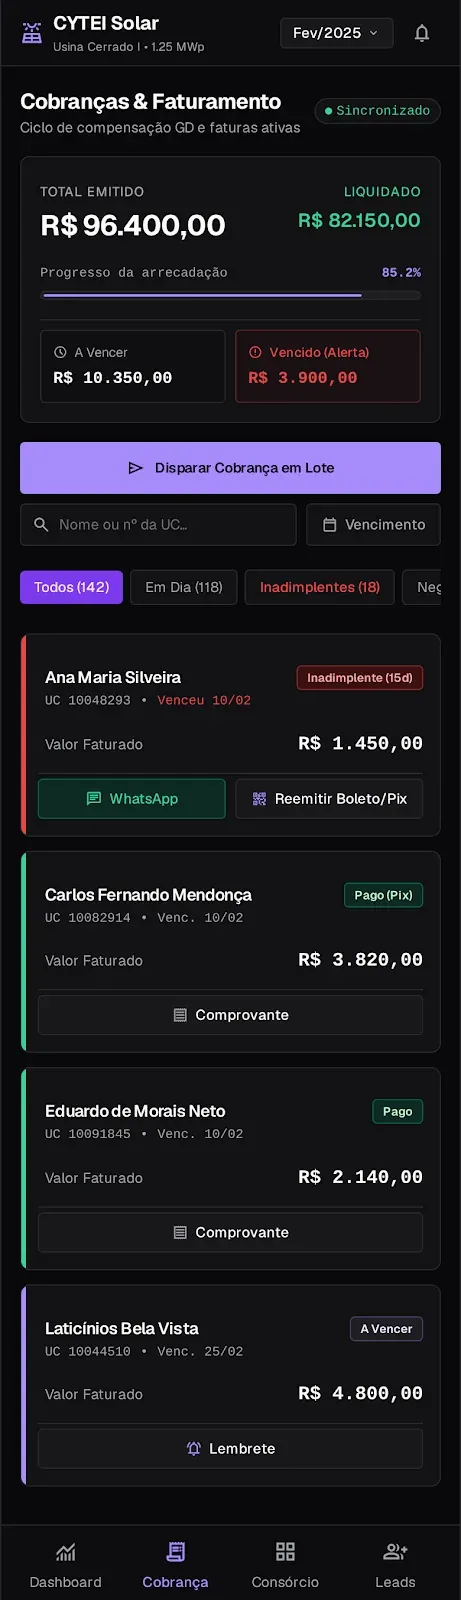
Billing: only the overdue card uses the alert color, and batch billing is the main action.
The billing cycle reads from left to right: issued, received, due and overdue. Only the last card has a red border, because it is the only one that calls for action, and the row of a consumer more than fifteen days late gets a reddish background.
In finance, actual months are solid and projected months are faded, with an asterisk: the difference between fact and estimate shows without a legend. In consumers, a journey stage column says where each client stopped, from qualified lead to active contract, and a funnel at the bottom sums up the portfolio.
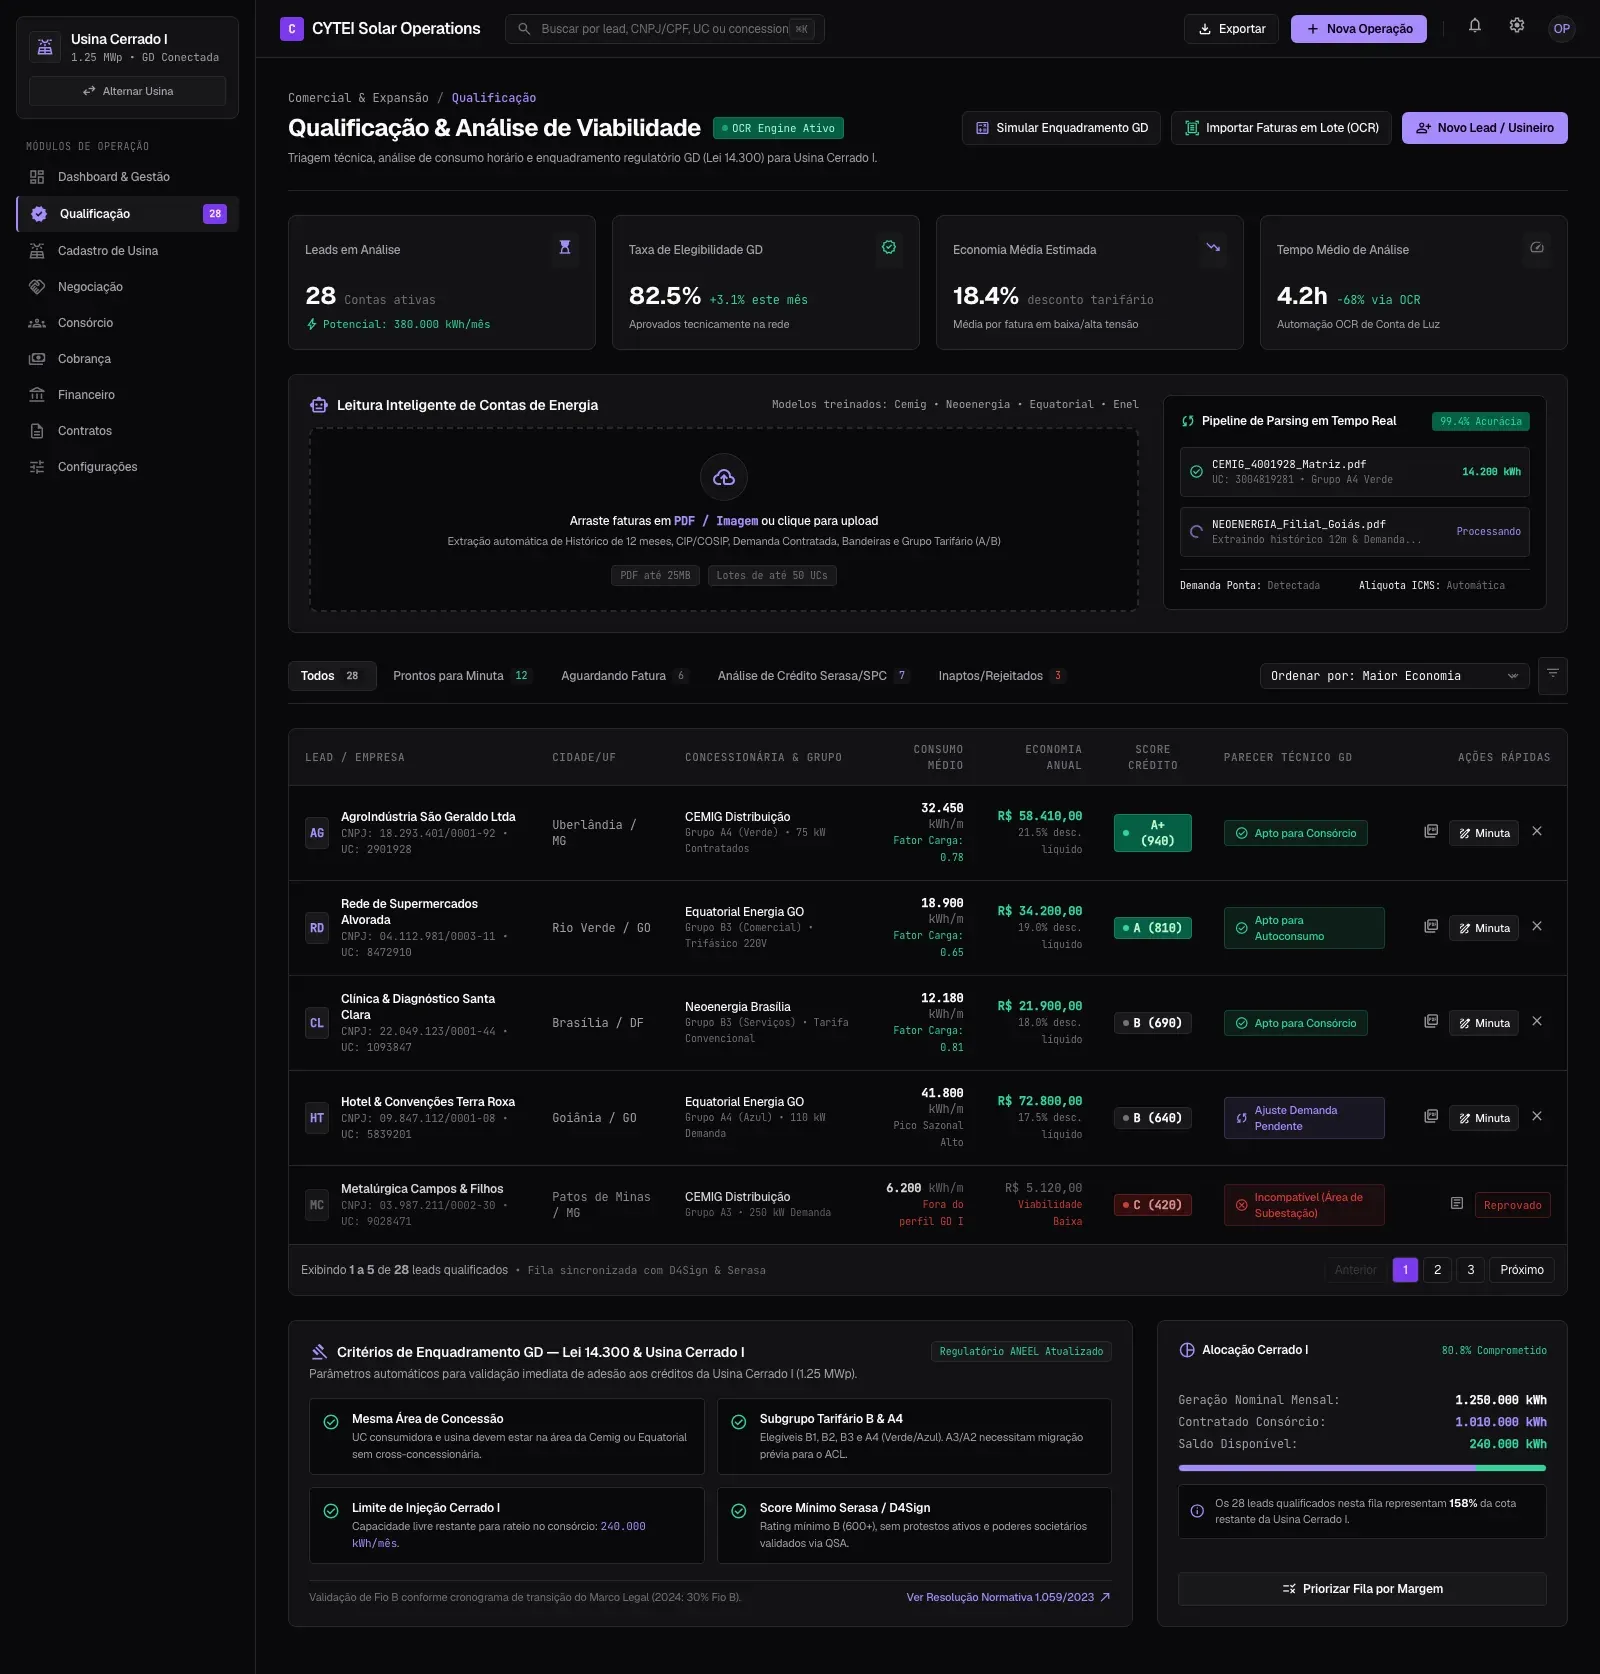
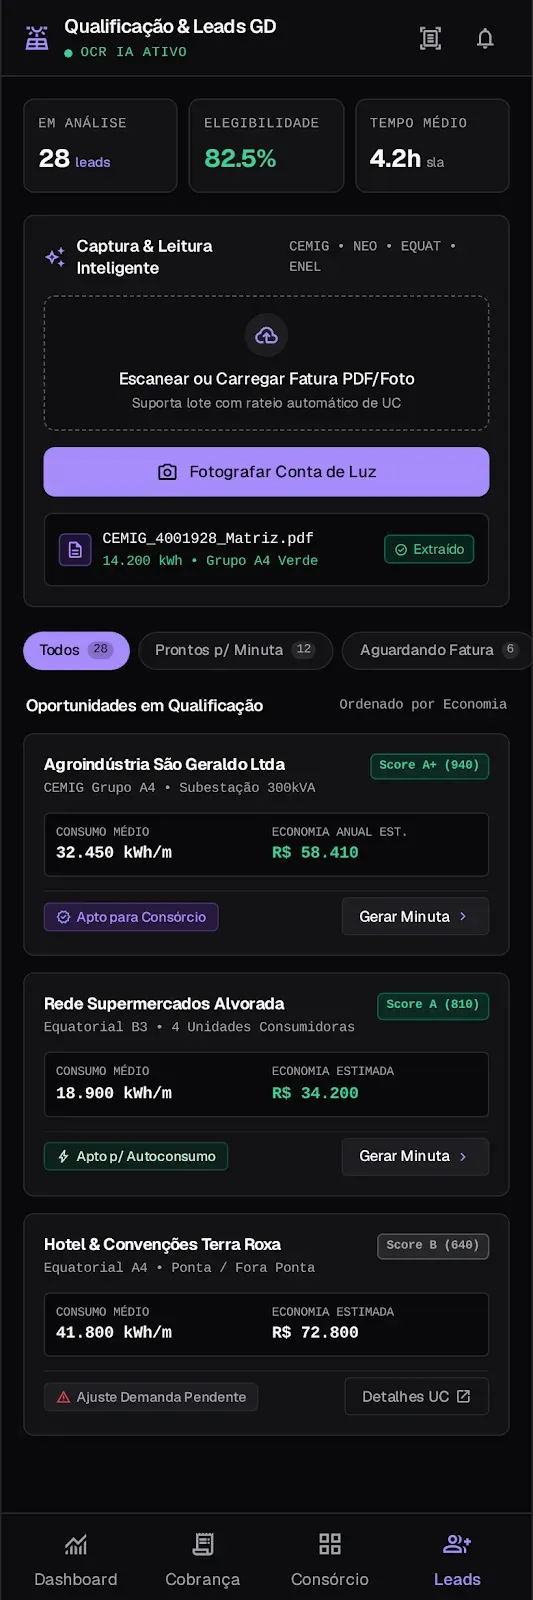
In qualification, the power bill became data: the plant uploads the PDF or a photo, and the lead comes in with a credit score and a technical assessment. The criteria sit on the same screen, so the manager understands an “ineligible” without opening a ticket.
Qualification: the rule appears next to the result.
In deals, investors, plants and specialists sit in tabs, and the specialists’ schedule became a gauge of who is working, available or booked. In contracts, six contract types become filters with counts, the table follows the order in which a lawyer reads one and alerts flag an inflation adjustment thirty days ahead.
Shared generation: the distribution bar and each member’s share use the same visual language.
In shared generation, a new module in the redesign, the screen first shows whether the plant is fully allocated and how the power is split among the members. In plant registration, numbered cards and a compliance strip say how much is left and what the one pending item is.
On mobile
The mobile version started from a different question: what does the manager handle away from the computer? The answer became the bottom bar, with dashboard, billing, shared generation and leads. Tables became cards with a status color strip, and the manager qualifies a client by photographing the power bill during the visit. Actions follow the status, in wide buttons within thumb reach: a late consumer gets WhatsApp and reissue slip; one who paid gets the receipt.
What I took away
Starting with the profiles and the architecture made it possible to ship five journeys in three months without one getting in the way of another. Six years later, the same structure took new modules and a mobile version without changing the navigation, and the visual rules held in the light theme, the dark theme and on mobile. A good architecture stays useful after the visuals change.
Harpia Networks · 2020
EZ Topology: an interface for mapping complex networks
I turned technical network settings into clear flows for infrastructure professionals.
Role
Junior UX/UI Designer
Contract
Contractor, 3 months
Deliverables
Wireframes, screens and a design system in Figma
0→1
product from scratch
4
critical journeys
DS
ready for the front-end
☾
native dark theme
The product
EZ Topology discovers the physical topology of a network over SNMP and emails the map within minutes. Manual work gave way to a process that takes minutes. Users buy tokens, install the collection agent and connect the system, and devices show up on their own. The audience, from tier-2 support to network administrators, knows the protocols and does not want hours of training.
The challenge
Terms like SNMP, IP and Meraki, shown the wrong way, would block usage. Each screen had to say what to do, why and what to expect, while dealing with:
technical settings without context;
a setup at risk of drop-off at several steps;
dozens of IPs validated in real time;
scans that take minutes and cause anxiety;
an audience ranging from IT students to senior administrators;
few visual references in the Brazilian market for tools this size.
My role
I owned the whole visual layer, with every component decision starting from the system’s needs and real customers:
Wireframes and architecture: every choice point and error path mapped before any visual decision.
High fidelity: screens with default, hover, focus, error, loading and empty states, so no failure goes unnoticed.
Figma design system: color tokens for the dark theme, type and spacing, named the way the front-end would use them.
Templates: standard configuration forms and results tables, to avoid rework.
Onboarding: three short screens, no long tutorial.
Dark theme for usability
Infrastructure professionals spend the day in low-light rooms. The palette starts from purple and deep blue; mesh gradients appear only on login, splash and onboarding, and inner screens use neutral surfaces that read faster.
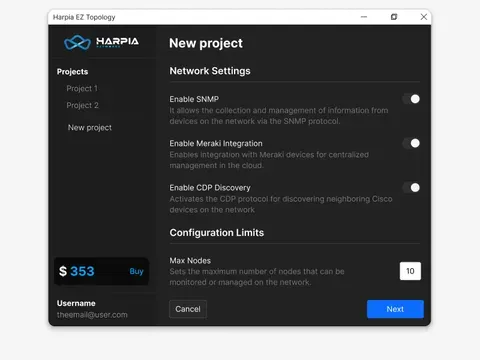
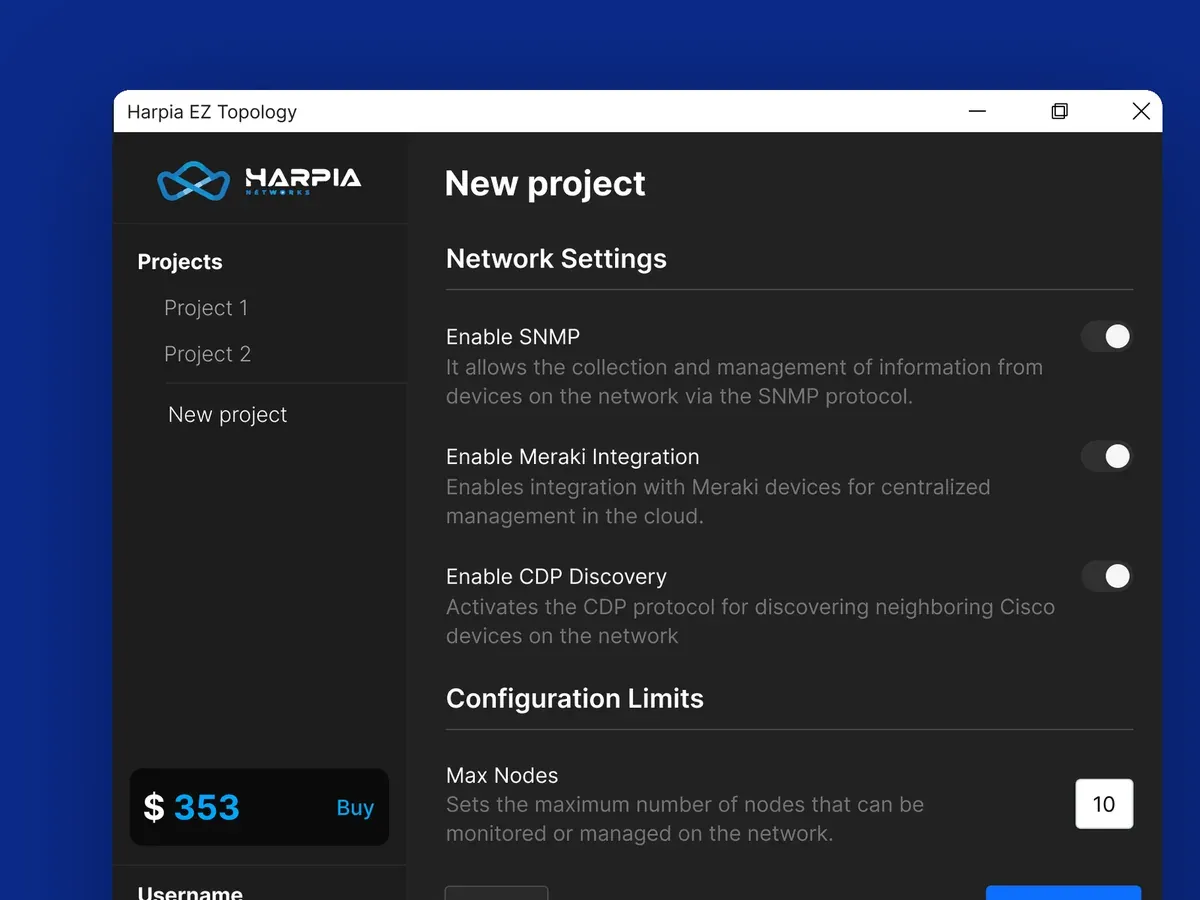
Sidebar as an anchor: projects, account and token balance always at hand, with the buy button highlighted without taking over the workspace.
Functional type: labels, descriptions and alerts separated by a strict hierarchy that prevents input errors.
Controls with context: SNMP, Meraki and CDP come with a short helper text, so nobody needs a PDF guide.
3D illustrations in onboarding: the benefits show up before setup even starts.
Login: the gradient as brand, only at the front door.
The flow to the map
Login: errors say what was typed wrong and how to fix it, and password recovery uses illustrations to ease a tense moment.
Onboarding: three screens that answer what the tool does, why to use it and how to start.
Setup: fields in steps and protocol selectors with helper text; the node limit weighs network size against the estimated token cost.
Mapping: IPs typed in or uploaded as CSV, validated in real time, blocking data that would break the scan.
Result: progress shows during the scan, the table lists the devices with quick filters and the map arrives by email at the end.
What I took away
Infrastructure interfaces affect data security and maintenance speed, and ambiguous information erodes the team’s trust in the platform. The work was keeping the exact technical terms inside a clean layout that speeds up configuration. The handoff included templates and state logic described alongside the code patterns.
Zeev · internal tool
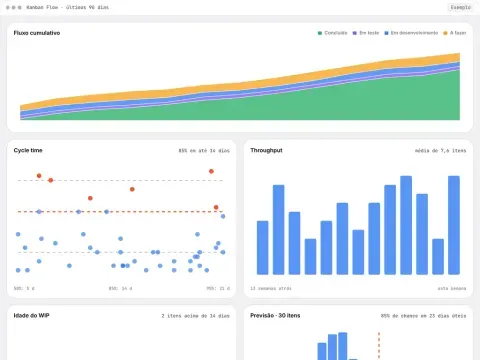
Zeev Kanban Flow: the team’s flow charts, in a tool of our own
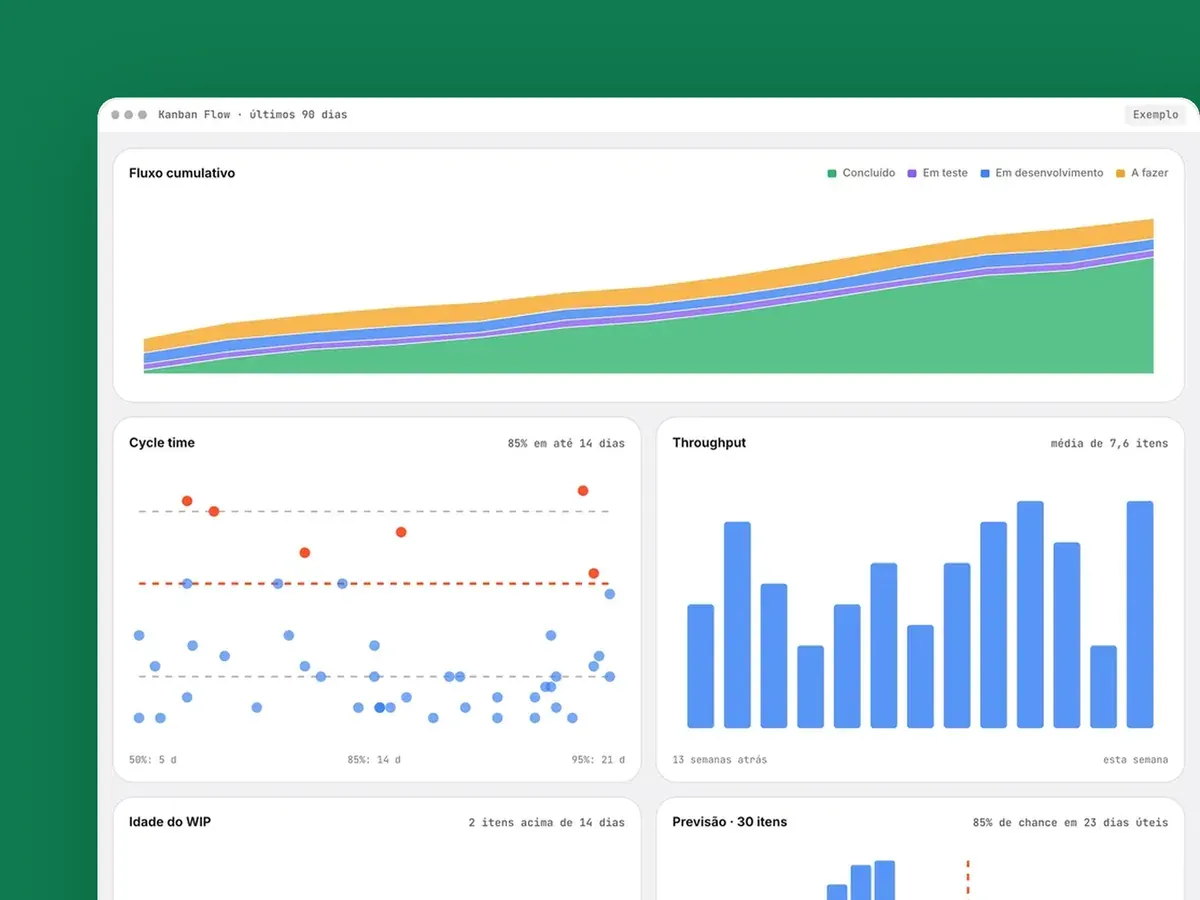
A web page with the kanban charts the Zeev team uses every day. It reproduces what we used to see in Nave, and the team stopped paying for the subscription.
Role
Idea, design and code
For
The Zeev team
Status
In daily use
Rebuilt with sample data: the tool is internal.
Flow metrics without a subscription
The Zeev team works in kanban and follows the flow in daily meetings. Kanban Flow reads the team’s board and draws the same charts that came from Nave: the team kept its metrics, stopped paying for the external tool and can adapt the charts to its own process. New team members get access without raising a bill.
Each chart answers one question
Cumulative flow: where is work piling up?
Cycle time: how long does an item take from start to finish?
Throughput: how many items does the team deliver per week?
WIP age: what has been in progress longer than usual?
Monte Carlo forecast: when will a batch be done, and how likely is it?
Percentiles instead of averages
A few very slow items pull the average up. That is why the dashboard says “85% within 14 days”: a promise that holds. Items over that limit turn bright red, and that is where the conversation starts. The forecast also comes with its risk, as in “85% chance within 23 working days”, and whoever asks picks the confidence they need.
ClippCut · my own product, 2026
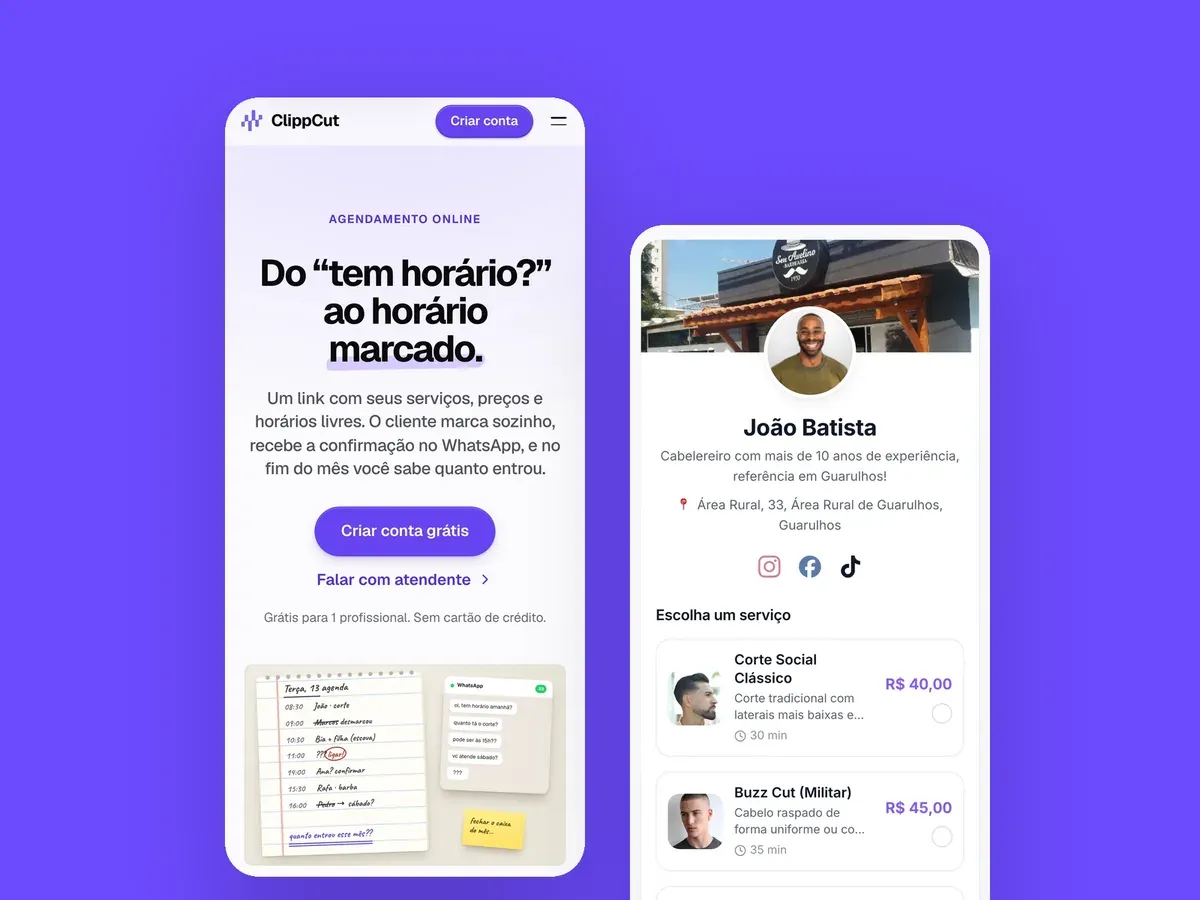
ClippCut: online booking with an AI assistant, built from scratch
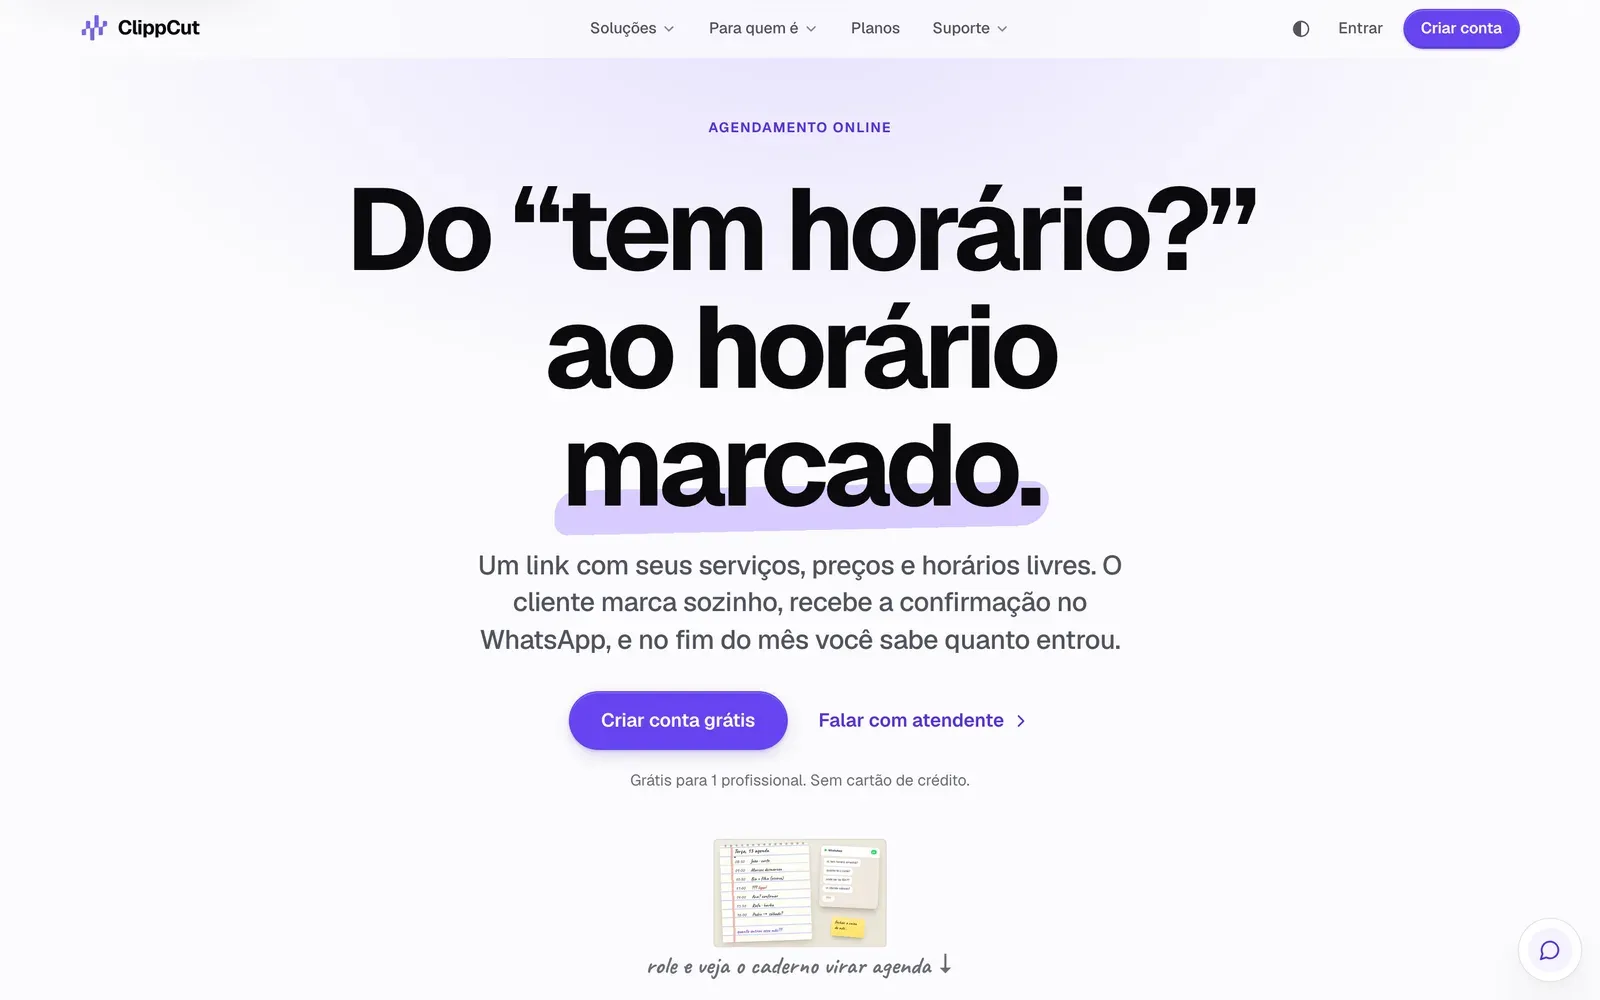
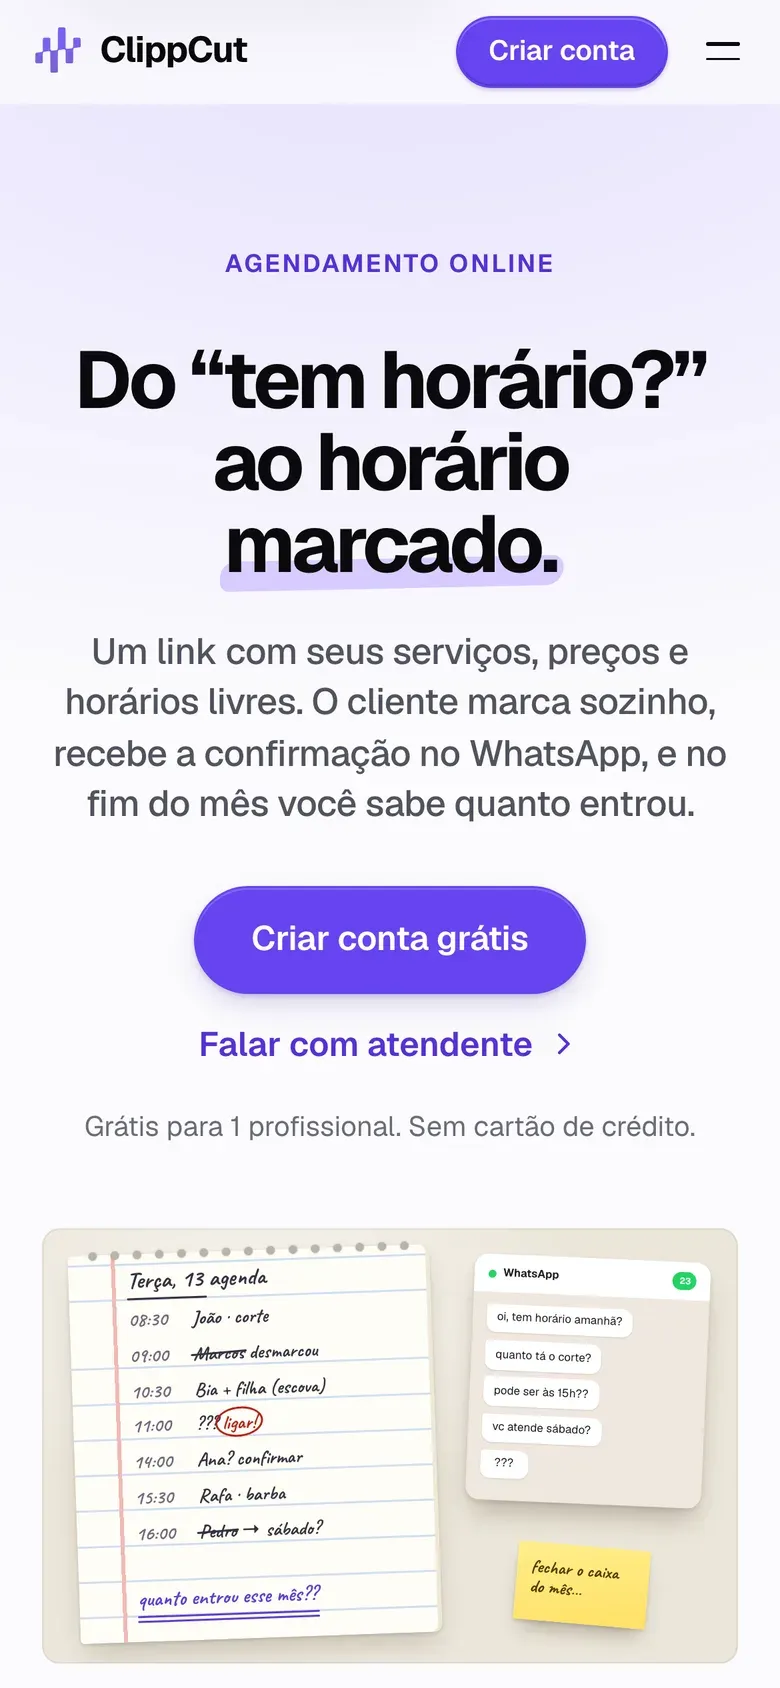
For people who work by appointment and still keep their schedule in a notebook and on WhatsApp. I built the whole product, from the brand to the database.
Role
Founder: product, design and code
Platform
Web and installable app (PWA)
Status
Live
3
repositories: app, site and WhatsApp gateway
179
database access tests
0
math done by the AI
The product
A barber stops mid-cut to answer “any slots?” and only finds out how much they made when closing the month. ClippCut gives each business a booking page for the Instagram bio: clients book on their own and get the confirmation on WhatsApp. The owner sees schedule, team and reports in a dashboard that installs on the phone. I started with the data model: every business is a company, even one-person ones, and the database only returns each login the rows of its own company.
Duration protects the schedule: a 90-minute service only shows where 90 minutes fit.
One schedule per professional, and the owner sees everyone’s numbers.
Each booking goes into a queue in the database, and the WhatsApp confirmation goes out every two minutes, with a retry when it fails.
Expected and actual revenue side by side, so nobody mistakes a promise for cash.
Where AI comes in
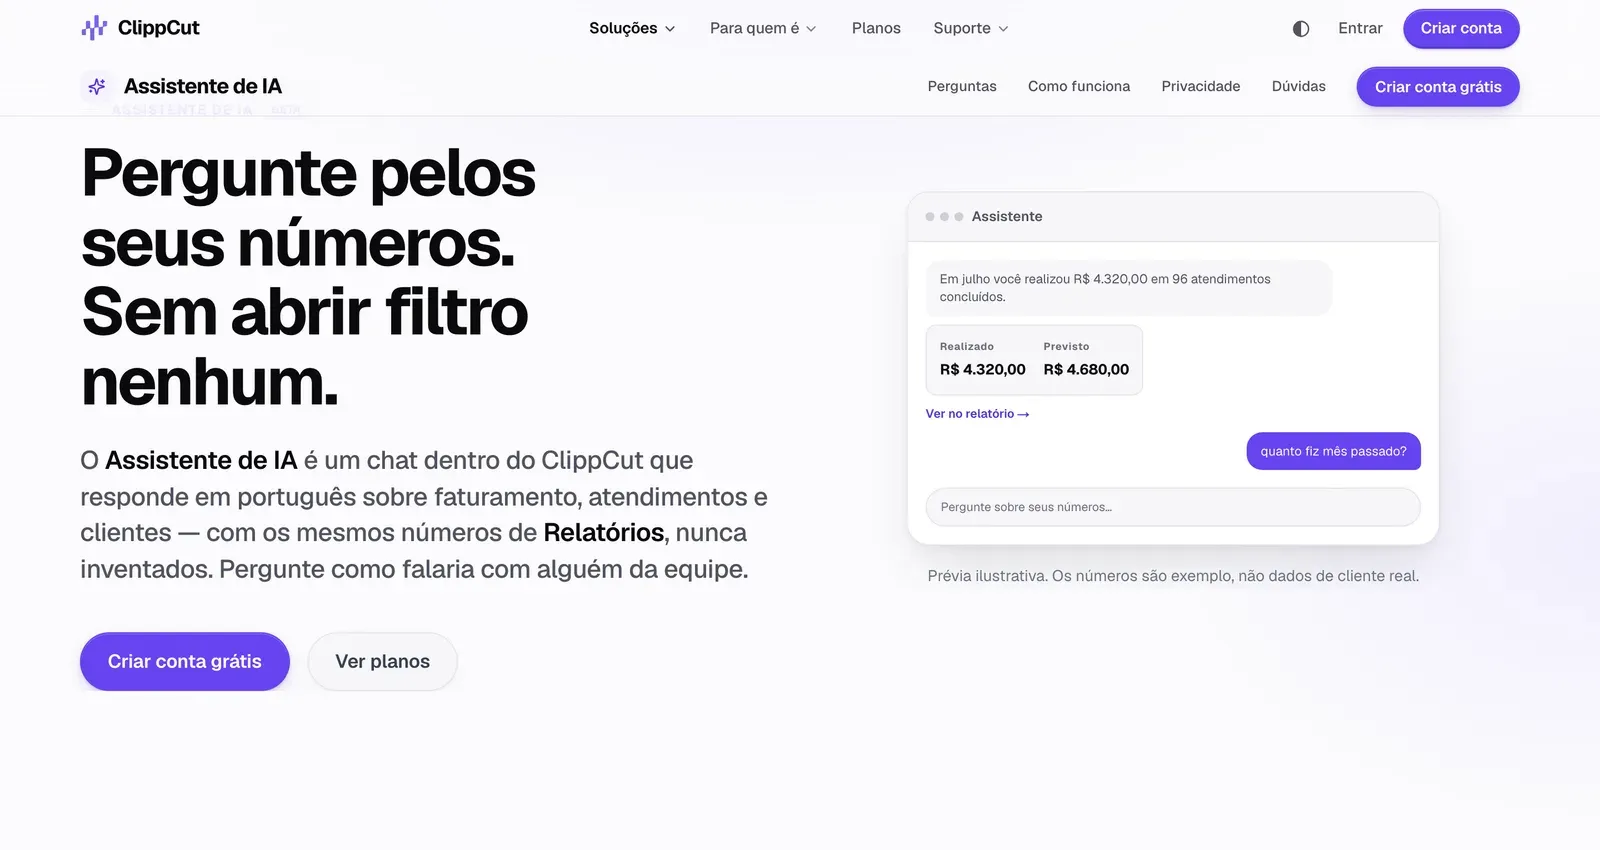
The owner asks in plain Portuguese: “how much did I make last month?”. The project rule is that the AI never does the math. If the model added numbers on its own, it would become a third source of truth, able to contradict the report on the next screen. I also ruled out letting the model write SQL: a query that forgot a status filter would return revenue different from the report.
The answer always shows the same number as the reports screen.
Interpret: the model only returns a JSON with the query and the period.
Run: an Edge Function calls the same Postgres function that builds the reports, with the login of whoever asked.
Write: the model gets the values already formatted in reais and only writes the sentence.
It takes three calls instead of function calling, because free models have patchy tool support, and strict JSON with validation works with any model. Numbers arrive ready because language models get arithmetic wrong: given 4320.00, one day it would write R$ 43.20. If writing fails, the answer comes from a sentence template in the code, with the same numbers. Client names, phone numbers and notes never leave the database.
How I built it
Brand and website in HTML, SCSS and Vite, with a page per segment and per feature. Supabase with Postgres, per-company access rules and 179 tests on a disposable Postgres; Vue 3 with Pinia in a PWA, a WhatsApp queue triggered by pg_cron and OpenRouter models in an Edge Function. During development, I pair-program with Claude Code. The plan for one professional is free, and the assistant is in beta, with a question quota per plan.
Boto · 2026
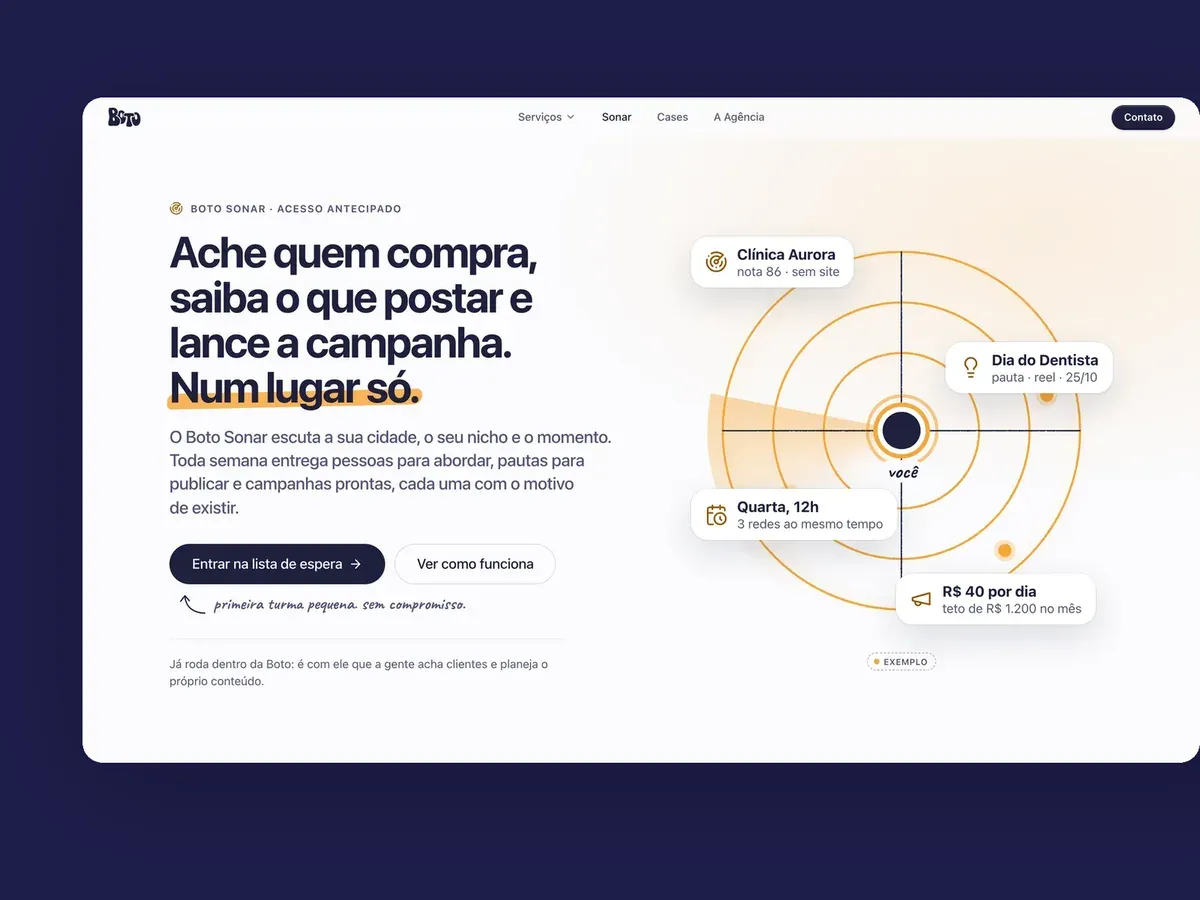
Boto Sonar: AI agents that find clients and suggest what to post
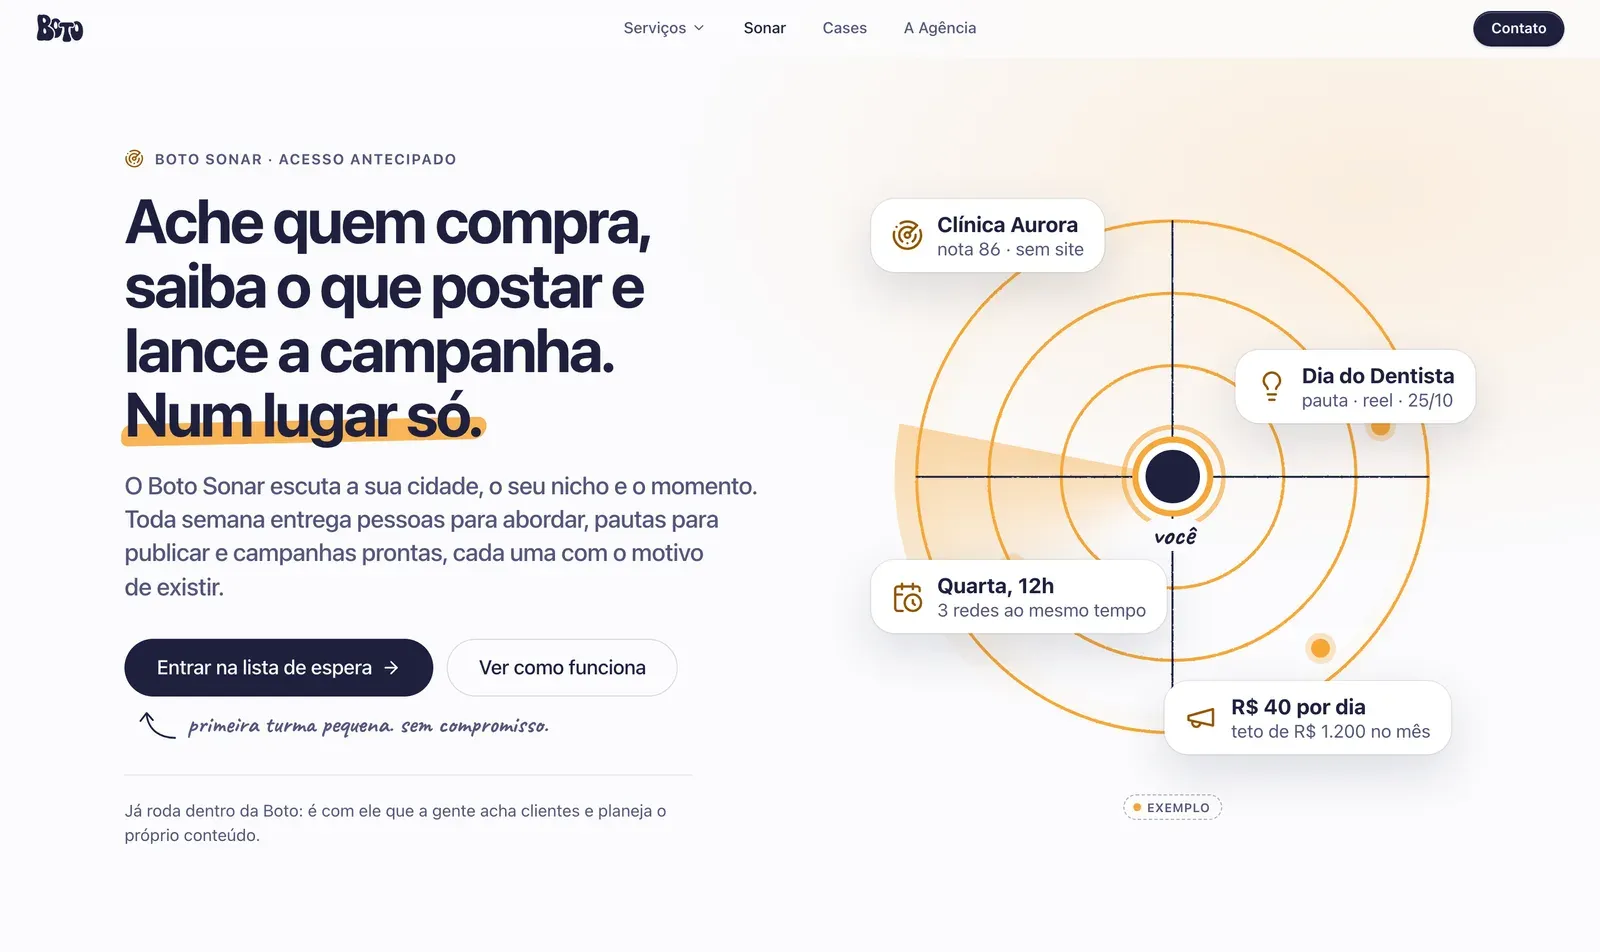
The platform Boto, the agency where I design and code, uses to find clients, plan content and follow every conversation to the contract. Now it is opening to other businesses.
Role
Idea, design, code and the agents
Platform
Web, with scheduled agents
Status
In use at Boto, early access
4 of 6
modules run every day
3
locks between the agent and the database
6:10 am
Radar runs on its own, Monday to Friday
100%
of leads with a source link
The product
A small agency finds clients in a spreadsheet, plans posts in another tool and runs ads in a third, and nobody knows which post brought in the client who signed. Sonar closes that loop:
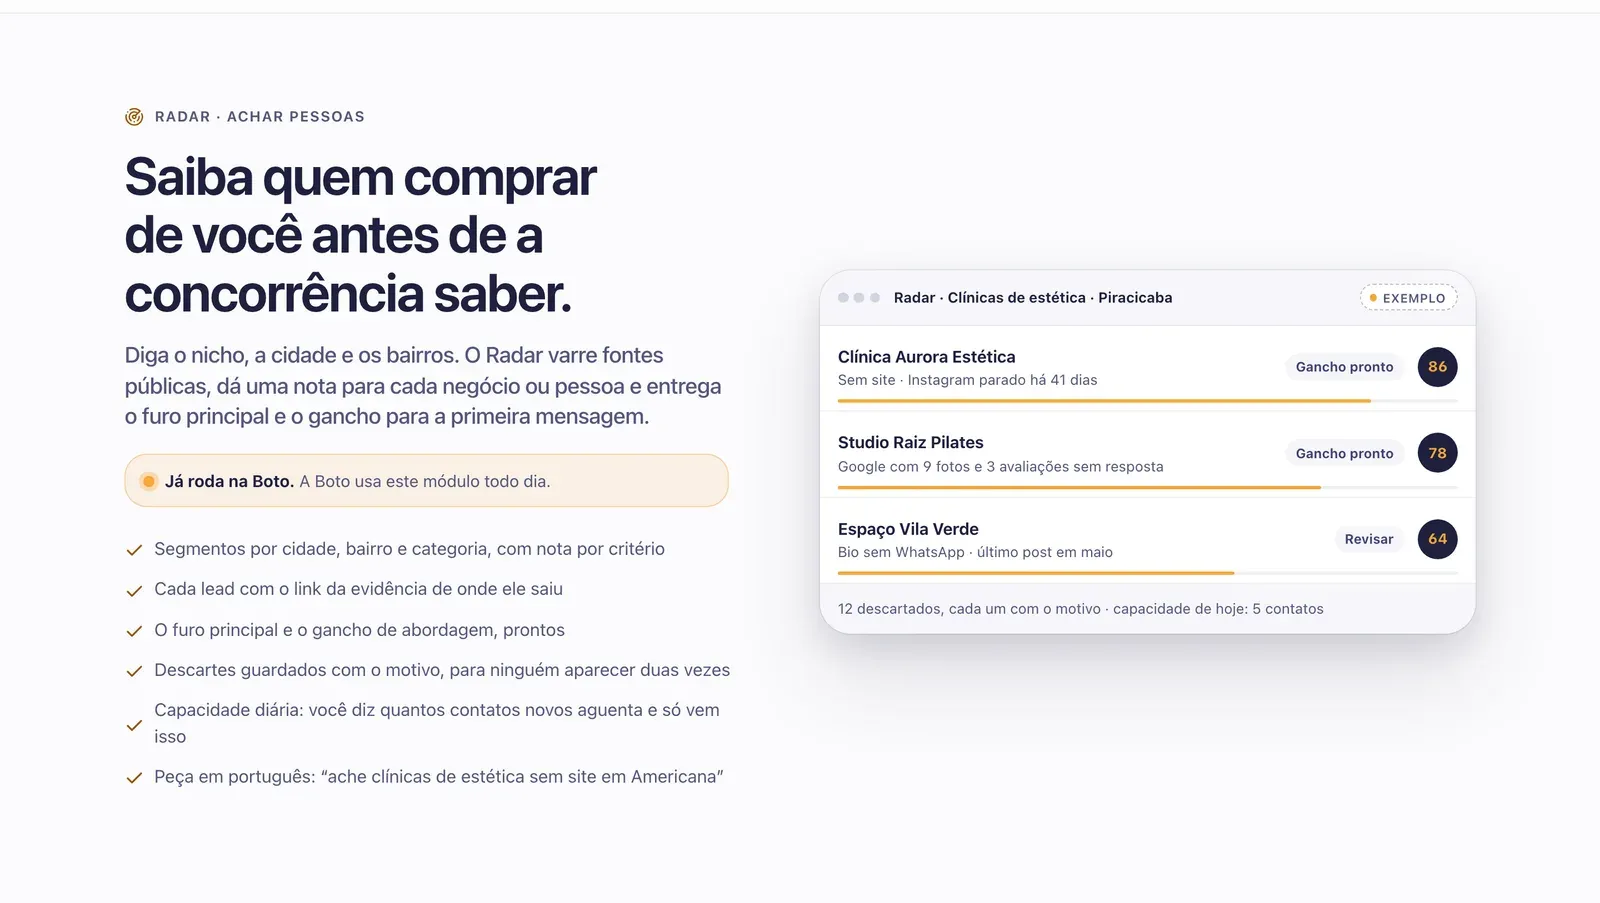
Radar: scans public sources by city, neighborhood and category and delivers businesses with a weak online presence, each with a score, the source and the hook for the first message.
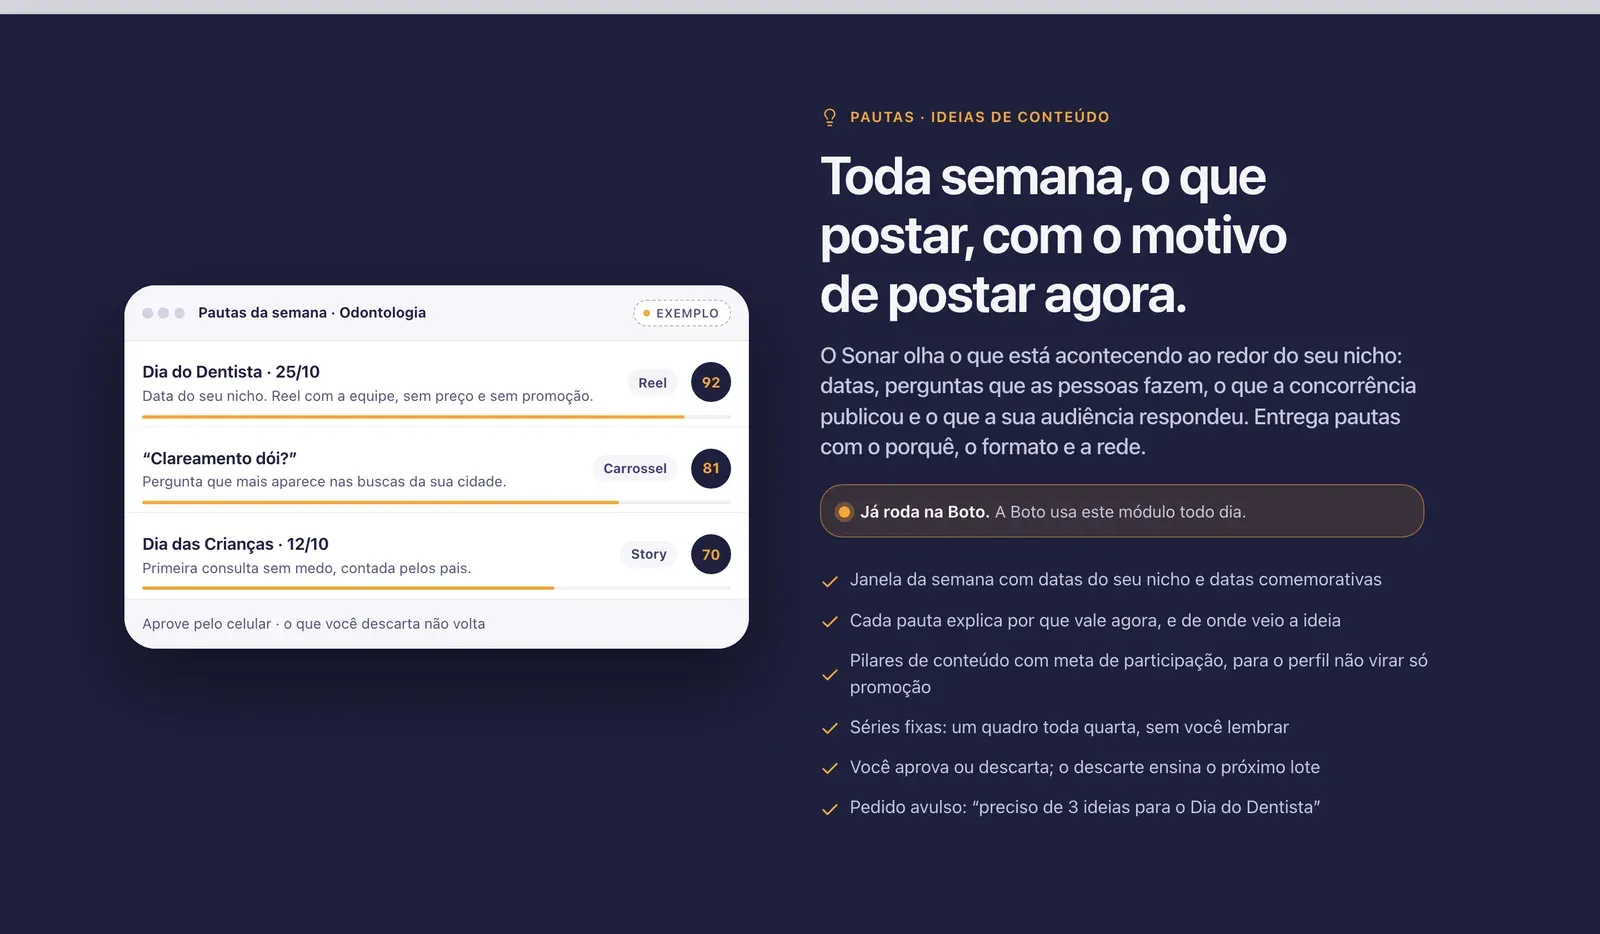
Content ideas: post ideas for the week, with the reason, the format and the network. Whatever the person discards teaches the next batch.
Pipeline: stages, owner and response deadline for every conversation to the contract, with its origin recorded.
Playbook: tone of voice, offers and approved replies, which the agents follow too.
AI proposes and a person decides: no lead enters the pipeline without review, and nothing goes live without approval.
Radar: every business arrives with a score, a source and a hook.
An agent that reads the web without touching anything
A web page can hide instructions meant to trick an agent. Radar and Content ideas are Claude agents that run as scheduled tasks, so I separated whoever reads the web from whoever has access to the system:
The agent that reads the web has no terminal and no password: it only searches, reads and writes files.
Whoever has a terminal only runs the CLI, which treats what the agent wrote as data.
The agent reads no tables: the server revalidates every candidate and rejects duplicates.
Every run follows a JSON Schema contract, and extra rules check, for example, that every cited URL was actually visited and that the first message is at most 350 characters, with no link and no price. Review is the last barrier: the agent never books a date, never contacts anyone and never changes an existing lead, and a business discarded in the last 90 days does not come back.
Content ideas: what to post this week, and why.
The rules live in the database
Pipeline stages, transitions and deadlines are Postgres functions tested with pgTAP: the interface asks and the database decides. The front-end is Vue 3 with Pinia, and Supabase with RLS shows each person only what their role allows. Each agent has an end-to-end test that runs offline, on the local database. Studio and Campaigns are under construction, and ClippCut already uses the same agents.